Chapter 4

Architecture of ocean monitoring and forecasting systems


CHAPTER
COORDINATORS

Avichal Mehra
CHAPTER
AUTHORS

Roland Aznar, Stefania Ciliberti, Laurence Crosnier, Marie Drevillon, Yann Drillet, Begoña Pérez Gómez, Antonio Reppucci, Joseph Sudheer, Marcos Garcia Sotillo, Marina Tonani, P. N. Vinaychandranand, and Aihong Zhong

4.2 Inputs required

To run an OOFS as part of Step 1, the following sources of information are needed:

  • Observations of EOVs are extremely important for an OOFS as they are used for assimilation and validation purposes. The main sources of observations are:
    • In-situ observations:
      • Buoys. Typically used to measure directional waves, atmospheric parameters (wind, atmospheric pressure and air temperature), EOVs (currents, temperature and salinity) and, less frequently, biogeochemical parameters. Some stations measure only on the surface, while others extend their observations to the whole water column. These variables are used for all kinds of OOFS: Wave information is critical for validation and is occasionally used in assimilation; oceanographic data are widely used in circulation modelling and the scarse biogeochemical stations are critical to complement the existing climatological data;
      • Tide gauges. Measuring sea level, tide gauges are extremely useful for the validation of storm surge and circulation models, sometimes also used in data assimilation. In recent times, with the increased frequency sampling of modern tide gauges their use to validate wave models in coastal regions has extended;
      • Argo drifters. Typically measuring profiles of salinity and temperature. More recently, bio-geochemical parameters are also being incorporated. This is an essential source of information for large scale circulation modelling;
      • Ship-of-opportunity. Usually measuring SST and SSS via thermosalinograph or releasing Expendable Bathythermograph to measure temperature throughout the water column. These data are usually employed for circulation modelling;
      • Gliders. Gliders can provide a 3D field of ocean structures that can be highly valuable for validation of circulation modelling and assimilation in regional and coastal scales. Gliders can also provide valuable biogeochemical information;
      • HF radars. The surface current fields are used for validation and data assimilation in circulation models. Additionally, the wave measurements can be used for validation in wave forecasting systems;
      • Marine Mammals CTDs. As in the case of the gliders, this is an increasingly important source of information that allows us to gather detailed information on small-scale ocean and coastal features.
    • Satellite observations provide information on the following variables:
      • Sea level anomaly. These data are a critical variable for data assimilation in large scale circulation models;
      • Sea surface temperature. As the previous, usually it is employed in data assimilation as well as in validation of ocean circulation forecast systems;
      • Sea ice concentration. Used for both validation and data assimilation in ice models, coupled to circulation models;
      • Waves. This variable is being used in large scale wave forecast systems for data assimilation and, on some occasions, for validation;
      • Ocean colour. Mainly employed for assimilation and validation in biogeochemical models. Can also be used as a secondary source for validation in circulations, since sometimes coastal structures are evident.
         
  • Bathymetric datasets. Bathymetry is at the base of every OOFS and, therefore, it is indispensable for all systems;
     
  • Surface forcing. Provided by operational NWP systems. These data are used for describing air-sea-sea ice interactions. Momentum, heat and freshwater fluxes are of paramount importance for all the processes at sea. Therefore this forcing is needed in almost any OOFS, with only a few exceptions (for example, some very high resolution wave propagation systems can operate without it, because the influence of forcing is already considered on other larger scales);
     
  • Land forcing fields (i.e. discharge of water and nutrients from rivers). Mainly used in circulation and biogeochemical modelling. This source of data is very relevant to provide accurate solutions at the coastline. Unfortunately, on some occasions real time data are not available and the modellers must rely on climatologies;
     
  • Ocean fields. They are provided by OOFS at larger scale to work as initial and boundary conditions (for example 3D temperature fields for downscaling applications in circulation modelling). When nesting, it is indispensable to have these fields. It is a frequent technique in all kinds of regional scale and coastal OOFS;
     
  • Climatologies. Sometimes climatologies are employed for validation or initialization when no other data are available. These data sources are also employed in validation processes, to check that the models do not depart too much from real values in regions where measurements are not frequent.


The following sections contain first an introduction on how to deal with ocean data from the perspective of the data provider, and then a description of the above mentioned data sources, including a list of international providers.

4.2.1 Obtaining and preparing ocean data

The quality of OOFS products is highly dependent on the availability of in situ and satellite observations; these are used, through data-assimilation, to constrain the analysis and the forecasting systems, and validate their outputs. However, prior to use these observations, they need to be properly retrieved, efficiently organised, and carefully quality controlled (Le Traon et al., 2009). In the architecture of an OOFS, this is accomplished by the so-called DMS, the data management component. The ultimate goal of this system is to ease the use of oceanographic observations, providing consistent and harmonised products ready to be used for data assimilation and validation.

Figure 4.2. Typical DMS data flow from upstream international networks for OOFS.

Figure 4.2 shows how data flow should be organised in a DMS. To get the most out of information, a DMS is responsible for gathering and organising the ocean observations (satellite and in-situ) in high-quality products and then to disseminate them in a timely fashion that meets the requirements of modelling and data assimilation centres. Once acquired, observation must be supplemented by uncertainty estimates and quality flags (part of the quality control process), which are key for validation and data assimilation. Then, they are prepared according to the specific file formats and distributed to users.

4.2.1.1 Data retrieval and characterization

First task of a DMS is to gather observations available from selected data providers (e.g. space agencies, international in-situ data networks, etc.). The choice of observations to be retrieved, processed and delivered depends on a previous analysis of the needs expressed by the prediction systems. In general, a tight coordination, upstream with data providers and downstream with prediction systems, is necessary to keep needs updated and ensure that the required observations are provided timely.

Ocean observations are made using several sensors, including in situ and remotely sensed ones, covering a broad range of spatial and temporal scales. Ocean observations made by remote sensing sensors usually include data for monitoring sea level, SST, salinity, surface wind and currents, sea ice, and ocean colour; these observations are acquired on a global basis and distributed at several different levels of processing, ranging from raw data to detected geophysical variables. Space Agencies (e.g. ESA, NASA, EUMETSAT, JAXA) are responsible for the provision of such observations.

In-situ observations are of paramount importance for OOFS because they provide information about the ocean interior that cannot be observed from space. In-situ observations can locally sample high-frequency and high-resolution ocean processes, in particular in the coastal zone, that are essential for model and satellite validation activities. In-situ observations are acquired through various network programs at both global and regional scale.

Data from a global prediction system, to be used to define boundary conditions of a nested regional one, or terrain/atmospheric forcing in certain scenarios will be part of the data to be inputted in the prediction system.

Knowledge of the processes that have been undertaken to produce a given observation and its characteristics is of high importance, as it allows a user to decide upon the product’s fitness for a particular application. To this end, it is important to ensure that metadata associated with each of the retrieved dataset contain the appropriate information (e.g. instrument/platform characteristics, tests performed and failed, origins of the data stream, data processing history, and information about the datasets).

4.2.1.2 Quality Control

In general, a Prediction System needs two types of input data. Initially NRT data are needed for hourly to weekly forecasting activities; at a later stage and for applications in which long term stability is needed (e.g. reanalysis, climate monitoring, and seasonal forecasting), DM data comes into play. Due to their different utilisation, quality control procedures for the two types of data are applied in different ways and with different methodologies.

NRT input data, delivered within a few hours to maximum one week from acquisition, are usually automatically quality controlled using a priori agreed upon procedures. For in-situ observations, quality control tests aim mainly at detecting outliers; these procedures check for inconsistencies in the measurements often using local statistics built from a long time series of similar data. Quality control of remotely sensed observations is performed by comparisons with in-situ observations when available, or by comparison to long-time series (i.e. climatologies) derived from the same product. These procedures aim at defining the accuracy of the product and detecting anomalous observations. As a result, for both in-situ and remotely sensed NRT products, quality flags are positioned to inform the users about the level of confidence and, where possible, the level of accuracy attached to the observations.

In-situ DM data are usually subject to an off-line quality control using statistical tests to check for spatial consistency and to a much more refined climatology test, usually with strong involvement of scientific experts in the quality-control process. Satellite observations delivered in DM usually benefit from improved ancillary data (e.g. more precise satellite ephemerides, meteorological reanalysis, etc.) used in the retrieval process, resulting in a more accurate product.

Besides the activities aimed at establishing the quality of the required observations, a DMS shall also monitor the performance of the different providers in terms of availability, possible degradation of their sampling, and timeliness. This additional information also needs to be regularly provided to prediction systems making use of these observations.

A DMS should also set up a procedure to gather, in form of reports, regular information on the data that have not been used by the prediction systems, because they were deemed to be of inadequate quality; this procedure, often called “Blacklisting”, has significant value for improving automated procedures for data quality control.

Table 4.1 shows the standard quality control (QC) indexes assigned to Copernicus Marine Service in-situ and satellite data.

CodeMeaningComment
00 No QC was performed-
1Good dataAll real time QC tests passed.
2Probably good dataThese data should be used with caution.
3Bad data that are potentially correctableThese data are not to be used without scientific correction.
4Bad dataData have failed one or more of the tests.
5Value changedData may be recovered after transmission error.
6Value below detection/quantificationThe level of the measured phenomenon was too small to be detected/quantified by the technique employed to measure it. The accompanying value is the detection/quantification limit for the technique or zero if that value is unknown.
7Nominal value-
8Interpolated valueMissing data may be interpolated from neighbouring data in space or time.
9Missing value-

Table 4.1. Copernicus Marine quality control flags as applied to Global Ocean In-Situ Near-Real-Time Observations product (INSITU_GLO_NRT_OBSERVATIONS_013_030, 🔗2).


4.2.1.3 Data Formats

Observations usually arrive at a DMS in a variety of formats, depending on the platform being used to acquire and broadcast them or on the software used to retrieve the variables of interest. For ease of use, a DMS will format all the incoming observations in data structures which satisfy the OOFS requirements. Data formats are usually defined during the development of the OOFS infrastructure in coordination with the prediction systems and detailed in dedicated documents. Besides a detailed description of the format in which the data or products will be stored, key subjects to be addressed in such documentation include:

  • Standards that will be used to build the data structures hosting the incoming observations (e.g. NetCDF format);
  • Semantics, provided by a recognized common convention (e.g., CF), which are then used to write metadata; 
  • A description of the transformation algorithms for all data handling (e.g. transformation algorithms to/from standards).

To enhance interoperability and sharing of data, non-proprietary solutions commonly used by the community are favoured during the selection of data format.

4.2.1.4 Data Delivery

The ultimate task of a DMS is to deliver datasets required for assimilation and validation activities to prediction systems, including uncertainty estimates that are critical for the effective use of the data. For the best possible exploitation of this data, an easy-to-access and robust service to visualise and access present and past available observations and associated metadata must be deployed. Metadata include latency information on data availability as a key parameter in the data flow. It is important that new observations are made accessible to the prediction systems with the shortest possible delay.

Access to data can be achieved in different ways:

  • “Pull services” enable users to request data according to their needs; this type of service should integrate tools that allow constraining the area of interest and time covered by the information;
  • “Push Services” are often based on subscription, which literally push the data to users following prescribed specific requirements.

Beyond visual navigation of data, a dissemination service should also include utility tools allowing transformation (e.g. format conversion and coordinate transformation), aggregation, and integration of a given variable regardless of source.

Another aspect to be considered as key for a successful dissemination service is the ability to perform appropriate extractions according to different data geometries (e.g. gridded datasets, unstructured gridded data, vertical profiles etc.).


4.2.2 Description of existing in-situ observational oceanographic data

In the next sections, it will be introduced the main observational oceanographic data from in-situ platforms used by OOFS. Details about their usage in numerical modelling and validation, as well as providers, are described in Chapters 5 to 9.

4.2.2.1 Buoys

Operational drifting buoys are a primary source of data on ocean surface conditions. They are deployed and maintained by autonomous groups, subject to different intergovernmental agreements, under the coordination of the Data Buoy Cooperation Panel (DBCP,🔗3). The Global Drifter Program (GDP) works in collaboration with national meteorological/oceanic agencies to routinely deploy large quantities of drifting buoys in support of their research and operational programs. Maintaining drifting buoy density distribution is a major challenge, due to the difficulty of high latitude deployments and because Lagrangian drifting buoys follow ocean currents and tend to cluster together near convergence zones.

Moored buoys are anchored at fixed locations, reporting temperature and salinity profiles, and are concentrated mostly in the tropical oceans and the coastal regions of Brazil, Europe, India, and the United States (🔗4). The different programs/agencies responsible for handling the tropical mooring networks are:

  • The Tropical Atmosphere-Ocean/Triangle Trans-Ocean Buoy Network in the equatorial Pacific (TAO/TRITON) (McPhaden et al., 1998);
  • The Prediction and Research Moored Array in the Tropical Atlantic (PIRATA) (Bourlès et al., 2008);
  • The Research Moored Array for African-Asian-Australian Monsoon Analysis and Prediction (RAMA) in the Indian Ocean (McPhaden et al., 2009).

The TAO/TRITON, PIRATA and RAMA moored arrays are part of the DBCP’s moored buoy network through the Tropical Moored Buoy Implementation Panel (TIP). 

Data from the DBCP GBN is transmitted through the GTS of the WMO and archived by the operational agencies. At present, the GBN has over 1,380 drifting buoys and 260 coastal/national moored buoys and 70 tropical arrays. While COVID-19 restrictions imposed stress on deployment opportunities, the drifting and moored buoy networks successfully maintained a healthy and resilient status in data quantity, quality, coverage and timeliness, due to the prolonged lifetime and improved performance of buoys (🔗5).

4.2.2.2 Tide gauges

Tide gauges are instruments on fixed platforms, located usually along the coastline, that measure water level with respect to a local height reference. Their primary objective is to support coastal zone monitoring and management, tide prediction, datum definition, harbour operations and navigation; additionally, they are used in sea level hazard warning systems, for climate monitoring, model validation and assimilation, and to detect errors and drifts in satellite altimetry. Tide gauge data complement the sea surface height data provided by the spatial altimeters, by providing higher temporal sampling (up to 1 min or less, allowing detection of higher resolution sea level phenomena) from in-situ data at the coast, where the quality of altimetry is lower.

The Global Sea Level Observing System (GLOSS; 🔗6) is the main international program responsible for collection, quality-control and archiving of tide gauge observations. The following data centres contribute to GLOSS data services:

  • PSMSL (🔗7), responsible for the global database of monthly and annual mean sea levels for long-term sea level change studies from tide gauges (🔗8);
  • UHSLC (🔗9), in which high-frequency tide gauge data (hourly and daily) can be found. Two datasets are provided, with different levels of quality control: research quality (updated annually) and Fast-Delivery (updated every 1-2 months);
  • IOC Sea Level Station Monitoring Facility (IOC/SLSMF: 🔗10), maintained by Flanders Marine Institute (Belgium), provides access to real-time raw tide gauge data, with shorter time sampling (< 1min) for tsunami monitoring;
  • SONEL (🔗11) is the GLOSS data centre for GNSS time series at tide gauge locations, if available. This information is the source of vertical land movement at the site and provides an ellipsoidal height reference of the tide gauge.
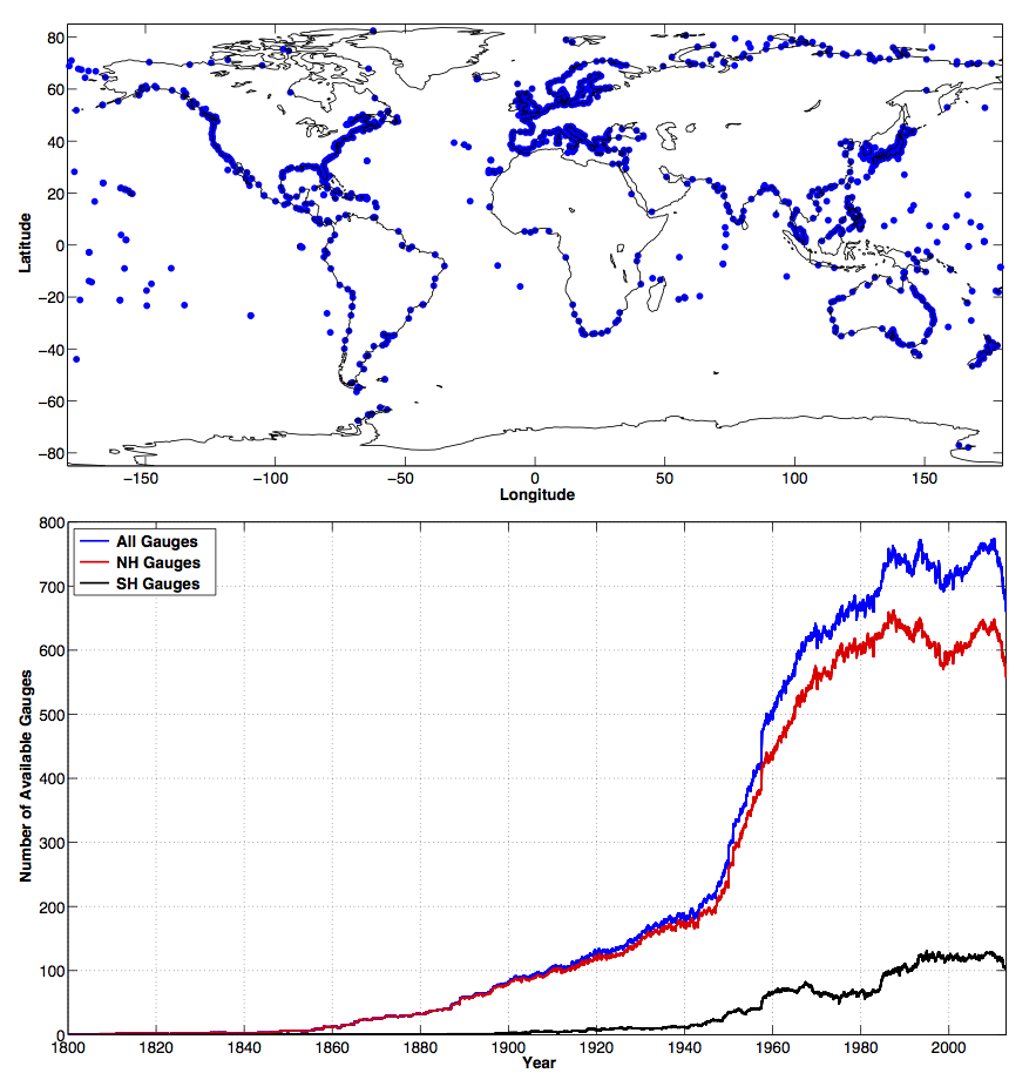
Figure 4.3. Top: global spatial distribution of the 1420 tide gauges in the PSMSL RLR dataset. Bottom: number of available tide gauges in the PSMSL RLR dataset through time (blue). Available gauges for the Northern Hemisphere (red) and Southern Hemisphere (black) are also shown for comparison. Source: https://climatedataguide.ucar.edu/climate-data/tide-gauge-sea-level-data

Figure 4.3 shows the global distribution of tide gauges together with the total number of installed stations from 1800 to 2000s (Hamlington et al. 2016), collected by the PSMSL. It shows the sparse distribution of tide gauges stations in some areas, such as Africa and South America. 

The EuroGOOS launched an initiative through its dedicated Tide Gauge Task Team (TGTT) working group (🔗12) to capitalise the expertise, usage and further improvement of the tide gauges network in the continent. This working group has launched several actions to enhance the connection between GLOSS and European data portals such as EMODnet and Copernicus Marine Service. These data portals integrate tide gauge data with other in situ, satellite and model data, and provide a one-point access for most of the tide gauges data for operational and scientific activities.

4.2.2.3 Argo

Argo is a global array of approximately 4,000 free-drifting profiling floats, designed to measure the temperature and salinity of the upper 2,000m of the ocean. The array covers the global ocean reasonably well and is one of the main in-situ observation data sources for ocean data assimilation and validation.

Each standard float has a resting depth of 1000m for 9 days. Every 10 days it is programmed to descend to 2000 m and then ascend to the surface measuring temperature and salinity in the ocean column. Data is transmitted via satellite and distributed on the GTS in BUFR code. Similar real-time quality-controlled Argo profiles can be obtained from two Global Data Assembly Centres (GDACs) - based one in Monterey, USA, and the other in Brest, France - that were set up as part of the international GODAE. For their behind real-time analyses, some operational centres use real-time Argo floats from both the GTS and the two GDACs.

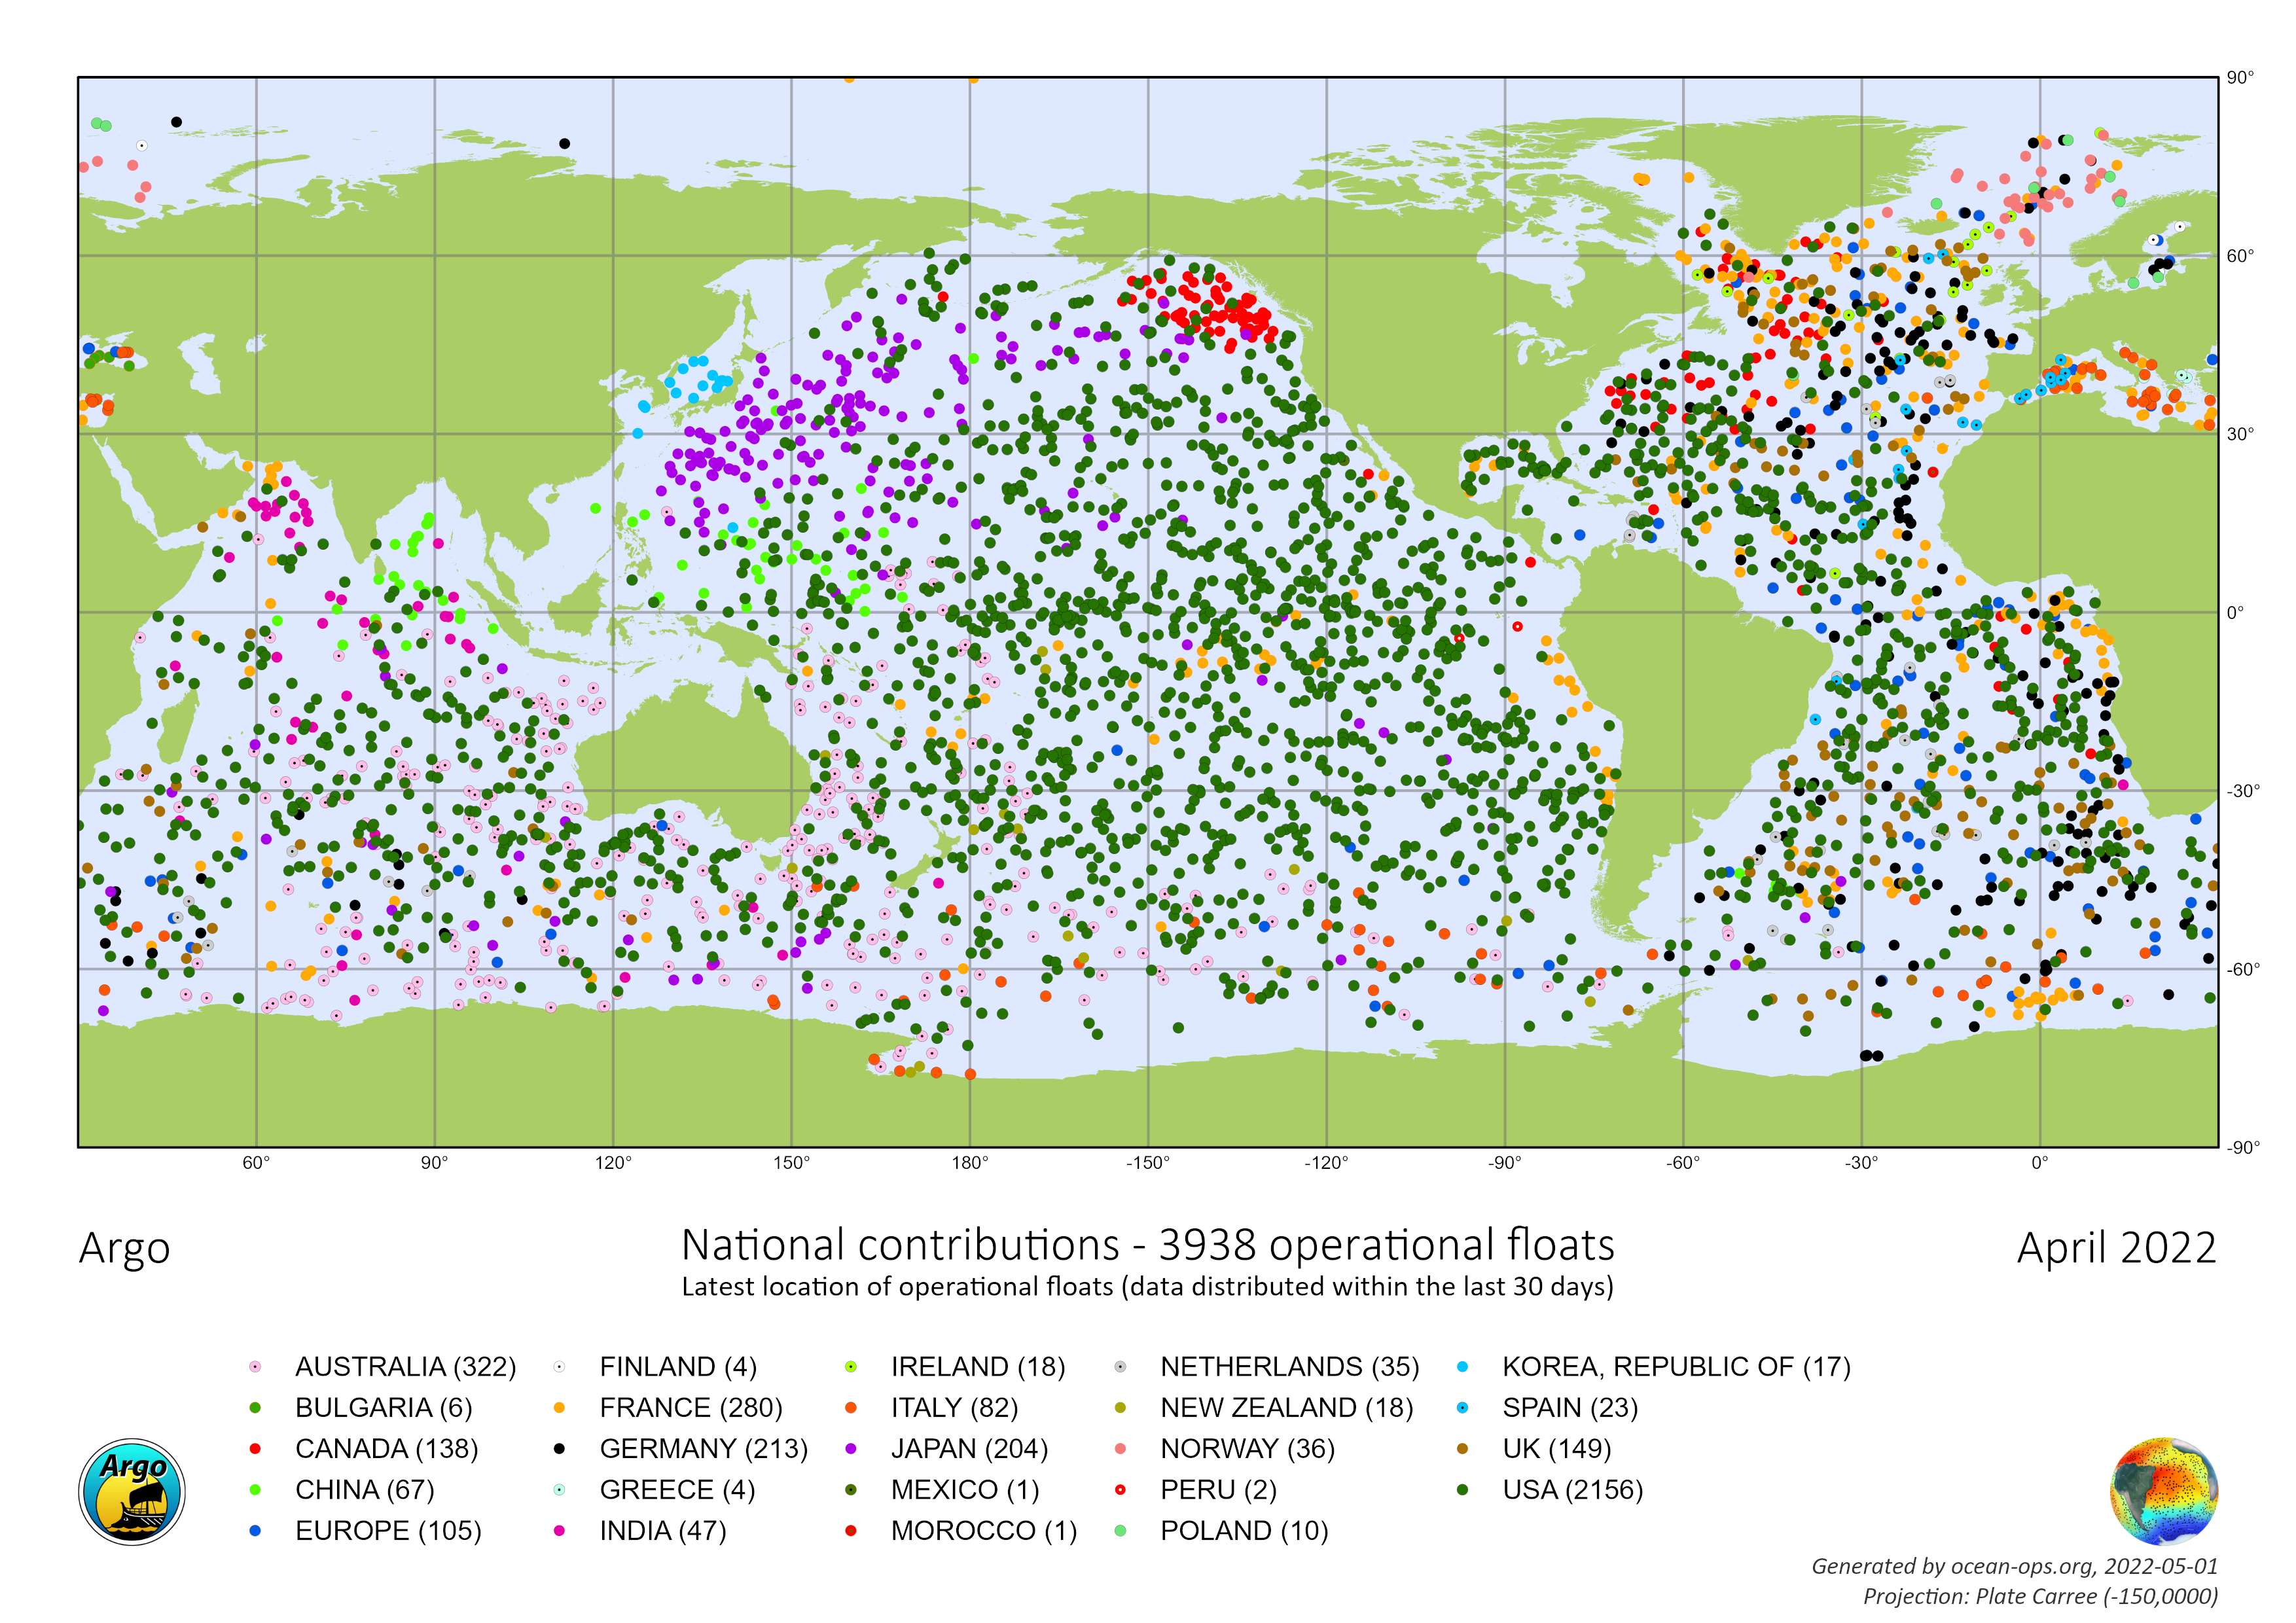
Figure 4.4. Global distribution of Argo network in January 2021. Source: https://www.ocean-ops.org/board

By 2020, Argo is collecting 12,000 data profiles each month (400 a day). The most updated picture of available operational Argo at global scale is shown in Figure 4.4. Further details are available at 🔗14. There was a slight 10% decrease in daily data flow in early January 2021, but overall spatial-temporal coverage has progressed since 2020 despite the challenges of the worldwide pandemic.

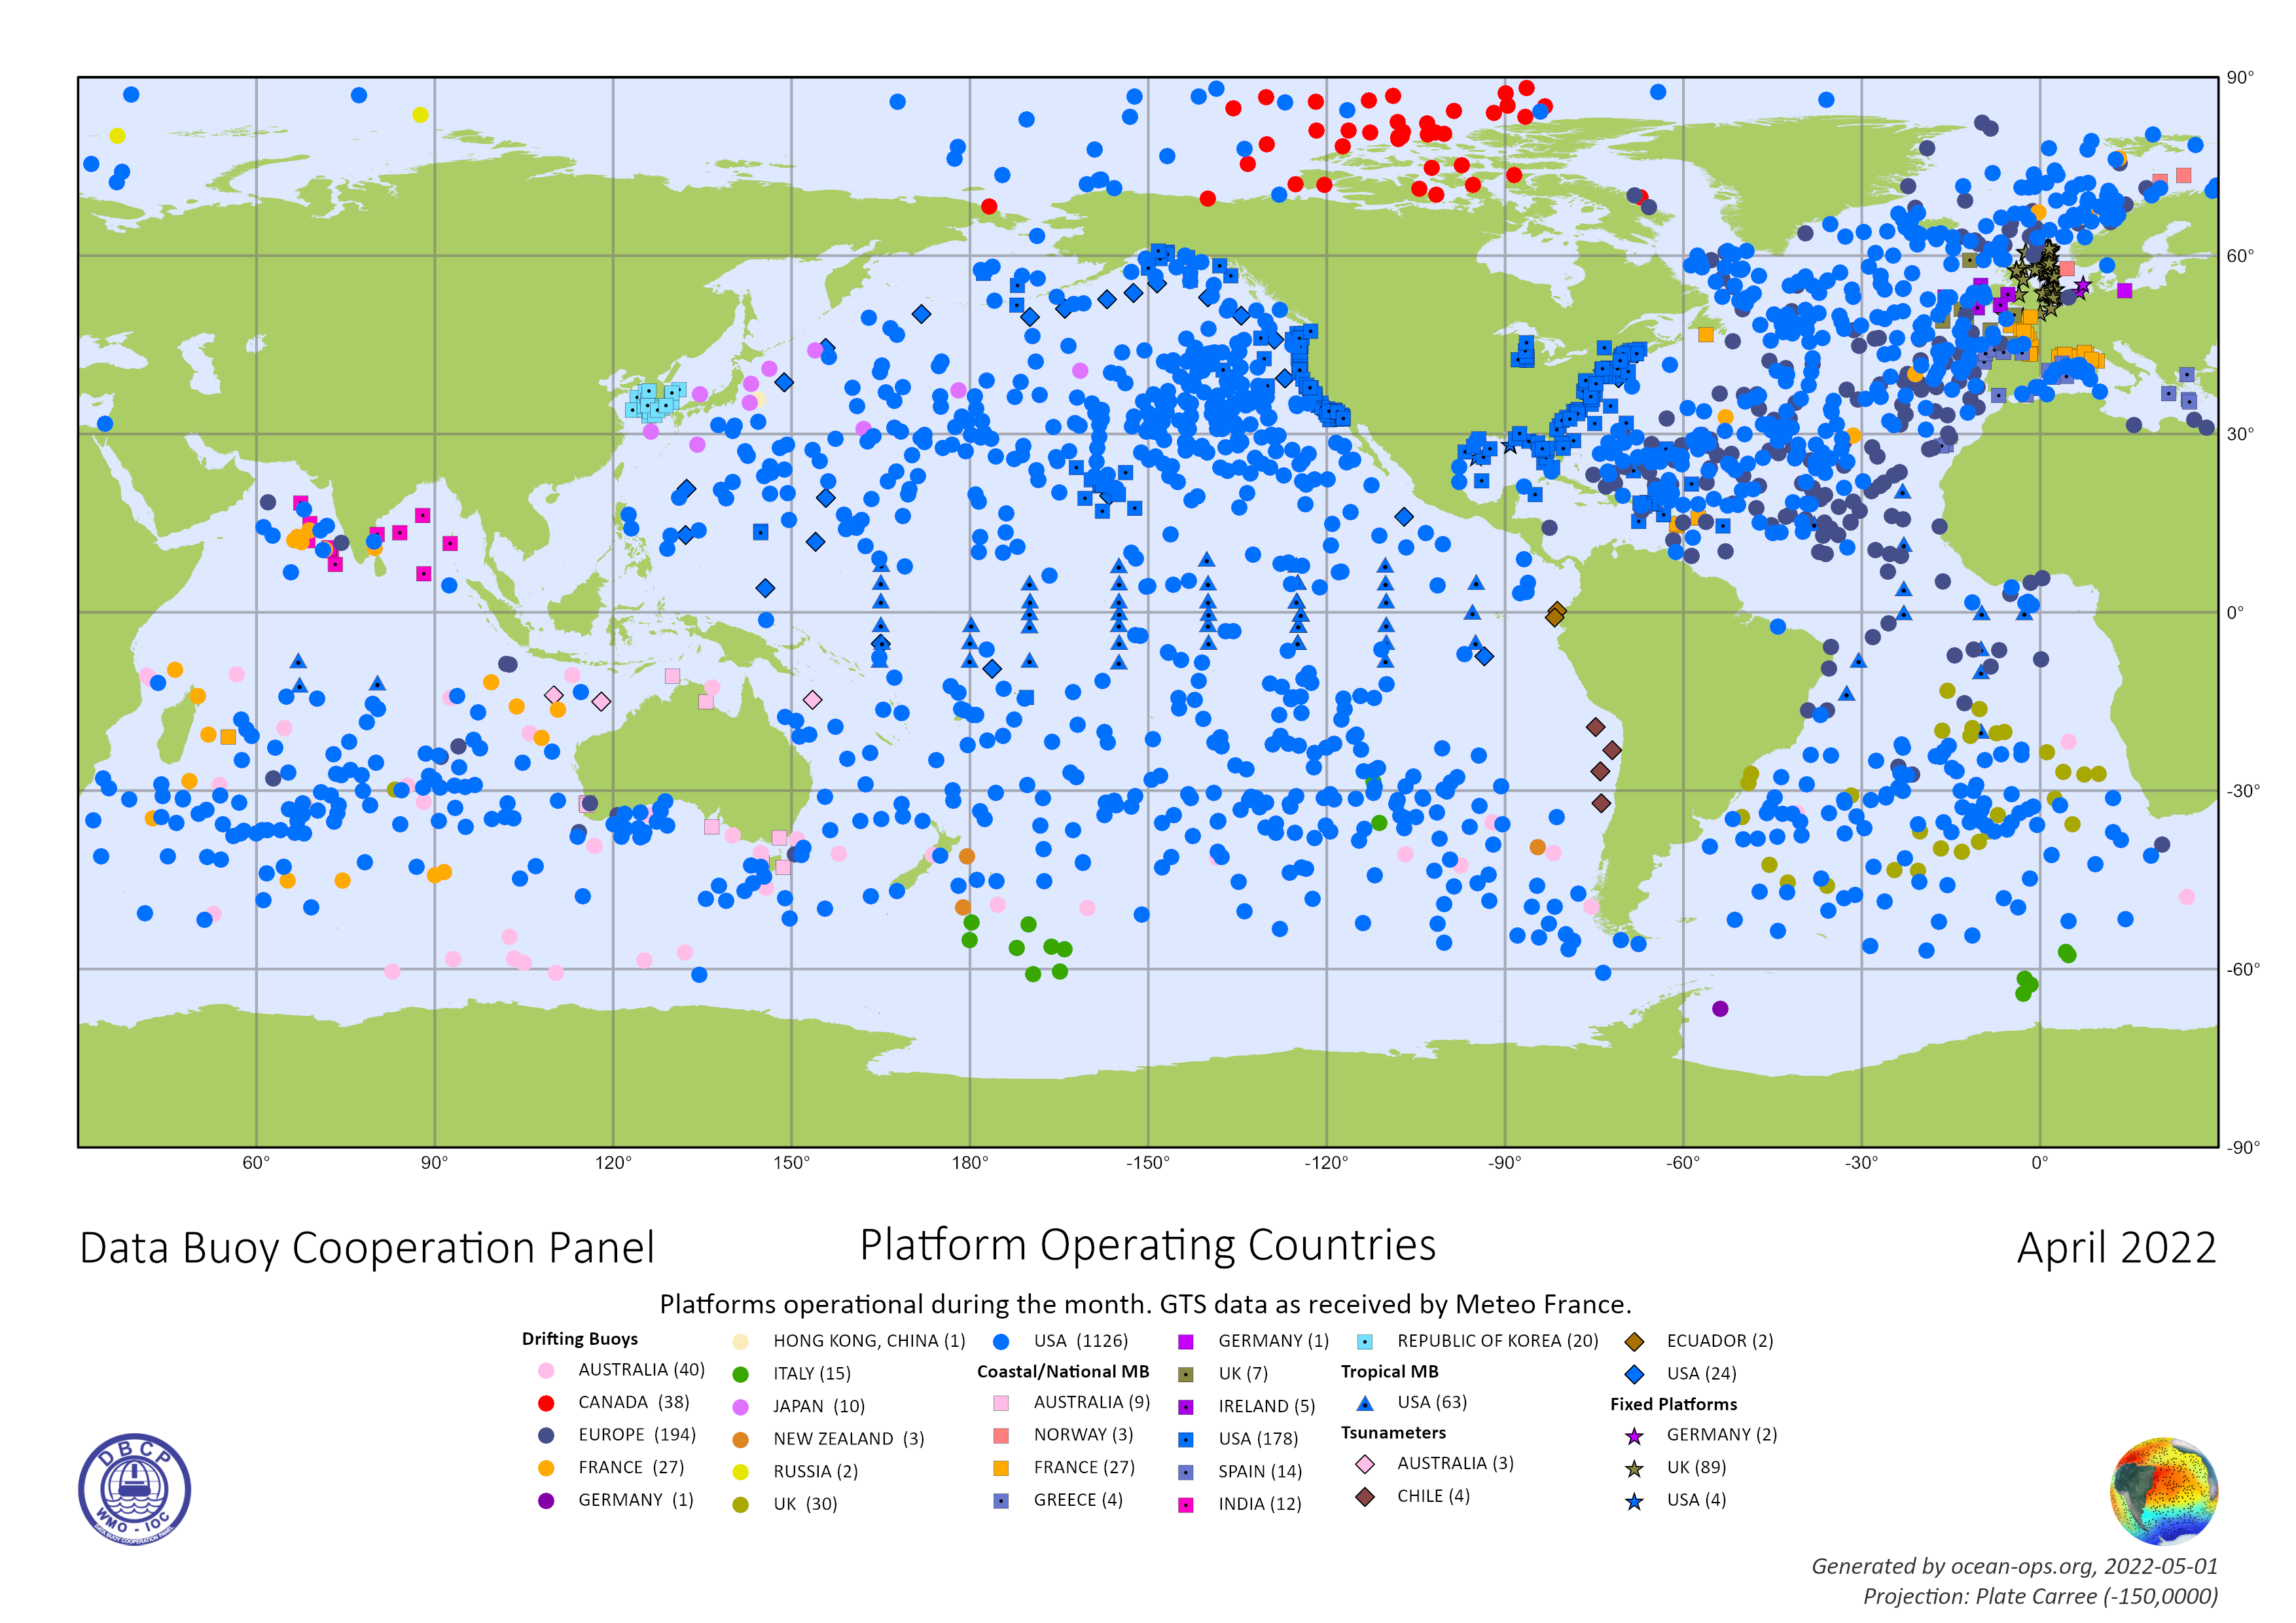
Figure 4.5. Global distribution of drifting buoys and moored buoys in January 2021, concentrated mostly in tropical oceans and coastal regions of Brazil, Europe, India, and the United States. Source: https://www.ocean-ops.org/board

Satellite-tracked surface drifting buoys are extremely cheap and useful to measure mixed layer currents, sea surface temperature, atmospheric pressure, winds, and salinity. They are part of the GDP and are able to reach a maximum 15 m depth. An updated map of operational surface drifters is shown in Figure 4.5. Further information is available at 🔗15.

4.2.2.4 Ship-of-opportunity program

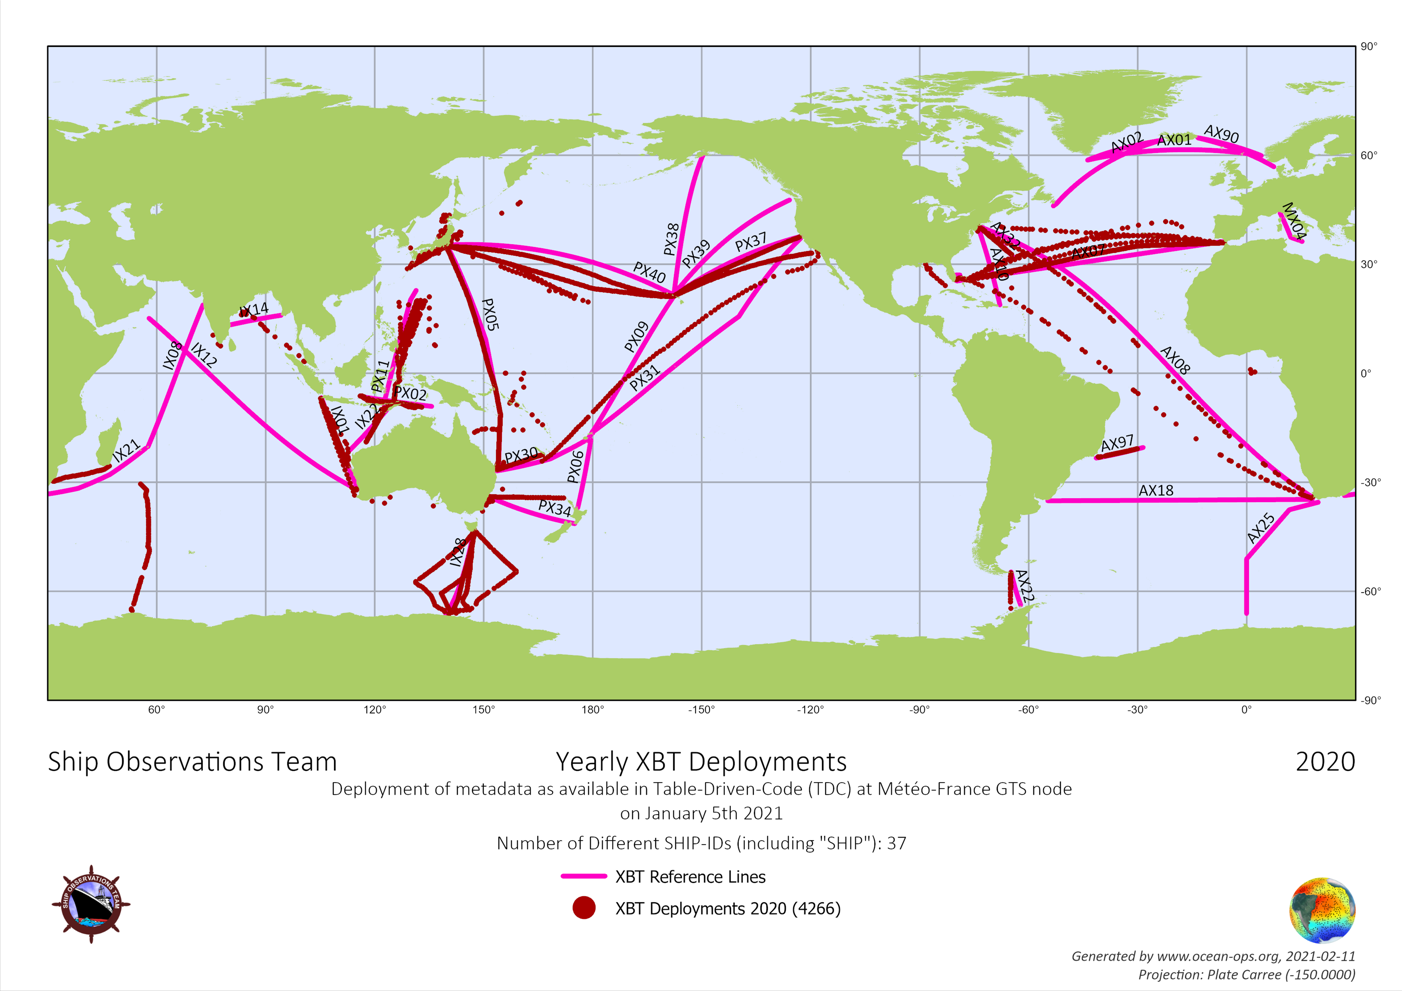
Figure 4.6. The network status of global XBT lines provided from Ocean-OPS in December 2020. Purple indicates the XBT reference lines and red indicates deployment in 2020. Source: https://www.ocean-ops.org/board

The SOOP, promoted by the JCOMM, is a network of merchant and research ships equipped with sophisticated tools and technology that allow scientists to explore ocean environments. The instrumentation usually used are:

  • XBT 🔗19, used to collect temperature observations of the upper 1 km of the ocean (Figure 4.6). Data from the XBT drop is automatically generated, transmitted by satellite and distributed on the Global Telecommunications System (GTS) in the Binary Universal Form for the Representation of meteorological data (BUFR) format. For operational use, these messages from around the globe are decoded and stored in real-time databases by each operational centre. Approximately 20,000 XBTs are deployed annually by the scientific and operational communities;
  • CTD 🔗20, which detects how the conductivity and temperature of the water column changes relative to depth. Conductivity is a measure of how well a solution conducts electricity and it is directly related to salinity. By measuring the conductivity of seawater, the salinity can be derived from the temperature and pressure of the same water. The depth is then derived from the pressure measurement by calculating the density of water from the temperature and the salinity. CTD are attached to a much larger metal frame called a rosette, which may hold water-sampling bottles that are used to collect water at different depths, as well as other sensors that can measure additional physical or chemical properties;
  • TSG 🔗21 are used for measuring sea surface temperature and sea surface salinity;
  • ADCP 🔗22 are able to measure how fast water is moving across an entire water column, using a principle of sound waves called the Doppler effect;
  • Research vessels and voluntary observing ships participate in the SOOP 🔗23.

The SOOP is directed primarily towards the continued operational maintenance and co-ordination of the XBT ship-of-opportunity network but other types of measurements, such as CTD probes, are also being made. The SOOP XBT program has been greatly impacted by the global COVID-19 pandemic. In early 2020, the program was temporarily suspended. However, almost half of lines resumed after June 2020, and by December 2020 there were 37 ships active on 25 lines (Figure 4.6), with 4266 profiles visible on GTS (source: 🔗24).

4.2.2.5 Gliders

Ocean gliders are autonomous underwater vehicles that move through the water column, ascending and descending with changes in buoyancy. Observations from ocean gliders have recently become an important data source in regional ocean data assimilation systems. The gliders are reusable and can be remotely controlled, making them a relatively cost-effective method for collecting repeated subsurface ocean observations. They also allow data acquisition in severe weather conditions. Equipped with a variety of sensors, the gliders are designed to measure ocean temperature, salinity and current profiles. Furthermore, the unique design of the gliders enables them to move horizontally through the water while collecting vertical profiles.

Figure 4.7. Active gliders in 2020-2021 - source: https://www.oceangliders.org/

The OceanGliders program coordinates 27 nations’ efforts, including 76 national and institutional glider programs (Figure 4.7). Despite the difficult context of Covid-19 restrictions, the OceanGliders program was able to operate over 200 gliders in 2020 (source: 🔗26). Most of the glider groups share their real-time data via the GTS network.

4.2.2.6 HF radars

HF radar systems measure the speed and direction of ocean surface currents in real time in coastal areas. They utilise high frequency radio waves for performing such measurements: a pair of radar antennas are positioned on shore and can measure surface currents (over 1-2 m in the water column) up to 200 km offshore with a resolution spanning from 500 m to 6 km depending on the radar frequency (🔗27(link is external)). Figure 4.8 shows a sketch (adapted from Mantovani et al., 2020) of mutual functioning of a pair of antennas - Radar A and Radar B: they measure the radial components (vector in blue from Radar A and vector in green from Radar B) that may be used to compute total velocity inside each discrete cell (vector in orange). This technology is increasingly used in many applications to support downstream services for coast guard search and rescue activities, oil spill emergencies, water quality monitoring and marine navigation. Nevertheless, they are extremely useful for validating coastal models as well as assimilating OOFS at regional scale.

Figure 4.8. Concept of surface current derivation from a two HF radar site network (adapted from Mantovani et al. 2020).

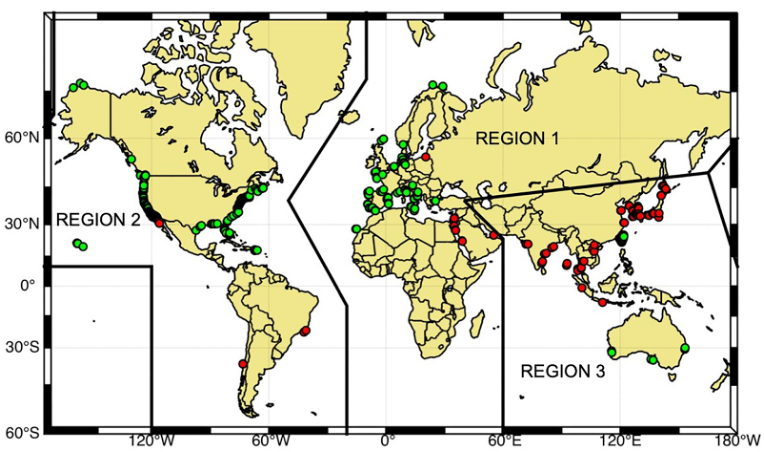
At international level, the GHFRN has been established as part of the GEO to promote high-frequency radar technology for scientific and operational activities along the coast. Roarty et al. (2019) include an updated list of countries and organisations providing surface current information to the GHFRN. Figure 4.9 shows the global distribution of HF radar stations organised within the three regions of the ITU. 

Figure 4.9. Global distribution of HFR stations: in green, stations that share their data with global data providers; in red, those that are private and do not share their data (Roarty et al., 2019).

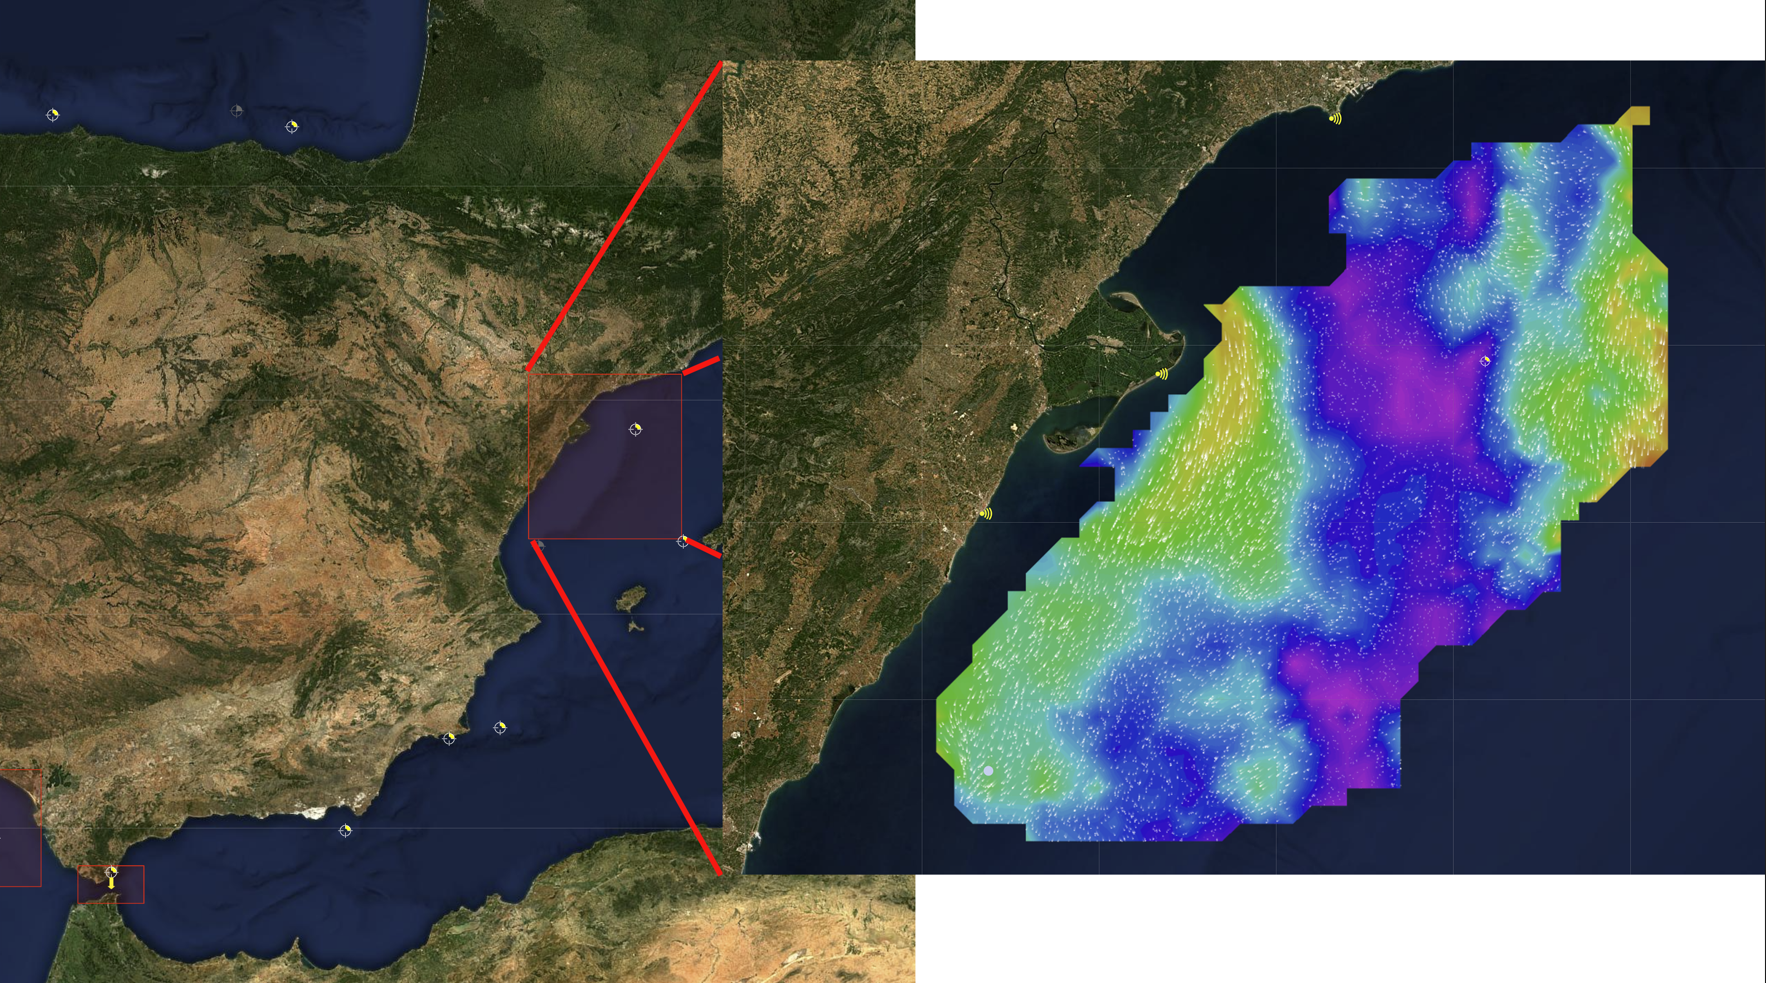
An example of an operational HF radar network is provided by that one managed by Puertos del Estado, operating in Spain, to monitor coastal and harbour zones. Figure 4.10 shows on the left the current operational HF radar network: selecting one of the regions in the red boxes - for example the Ebro Delta, on the right - the user may visualise the animation of the measurements collected during the reference observing period. Data may be accessed through the EMODnet Physics webportal.

Figure 4.10. An example of HF radar network: the case of the Ebro Delta monitored by Puertos del Estado (Spain) - source: https://www.puertos.es/en-us

4.2.2.7 Marine Mammals CTDs

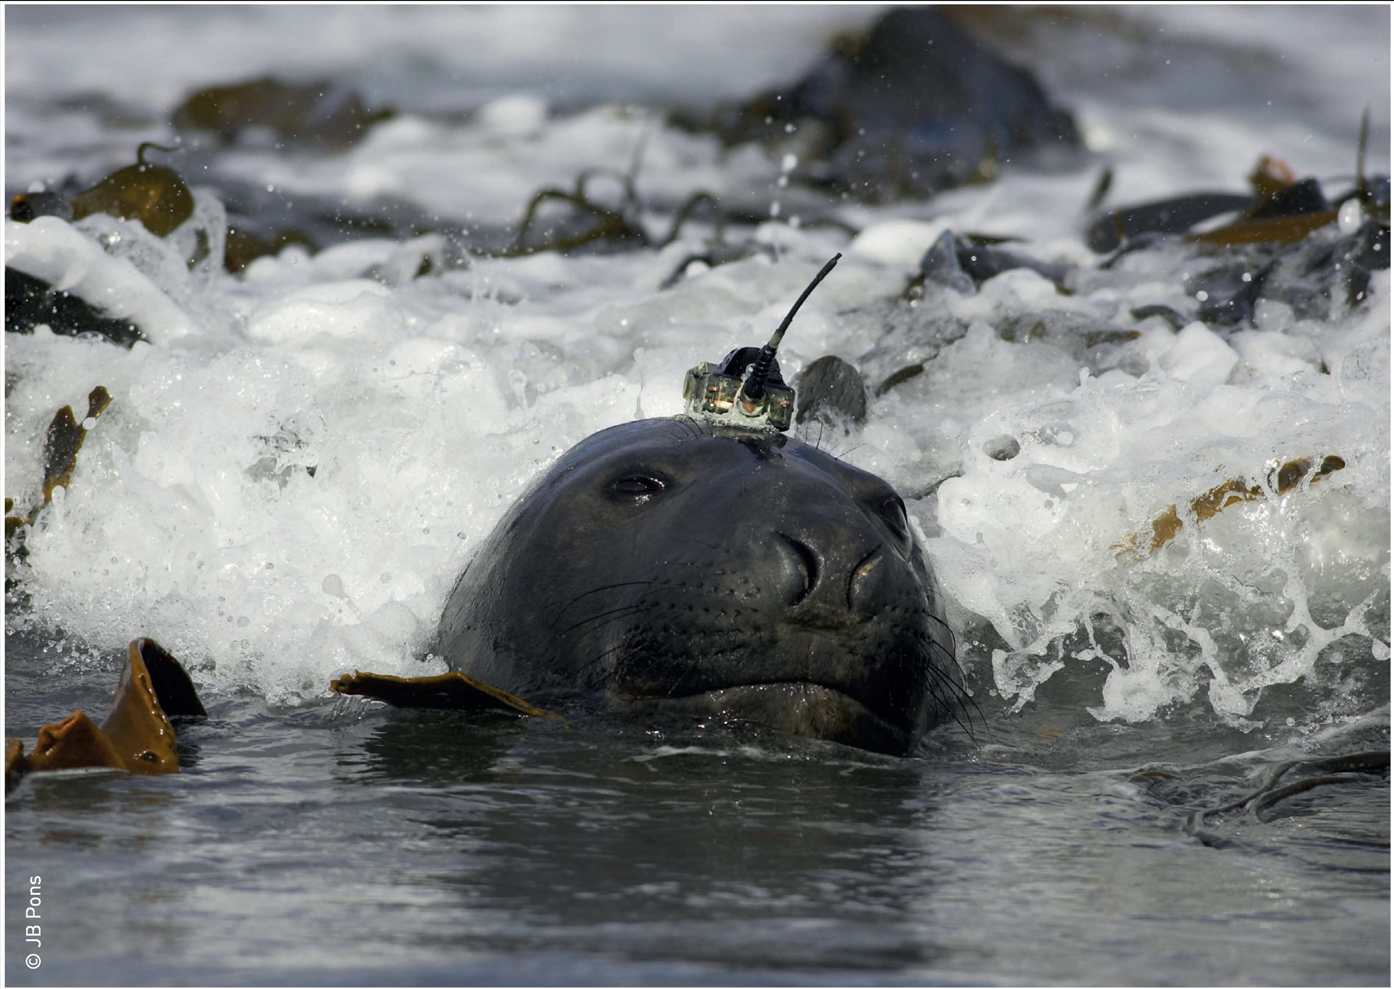
Marine mammal CTD data are very important for ocean modelling and sea ice verification in high latitudes, particularly in the marginal sea ice zone. Since 2004, several hundred thousand profiles of temperature and salinity have been collected by instrumented animals (Figure 4.11). The use of elephant seals has been particularly effective to sample the Southern Ocean and the North Pacific. These hydrographic data have been assembled in quality controlled databases that can be accessed through the MEOP consortium29 (🔗30).

Figure 4.11. Elephant seal with CTD tag ©JB Pons, in C. Guinet, 2018, CEBC/CNRS - available at https://www.cebc.cnrs.fr/wp-content/uploads/publipdf/2019/GC124006.pdf

Currently, the MEOP data portal distributes three different databases:

  • The MEOP-CTD database: quality-controlled CTD profiles;
  • The MEOP-SMS database: submesoscale-resolving high density CTD data; 
  • The MEOP-TDR database: high spatial density temperature/light data.

Real-time marine mammal CTD data are uploaded to the GTS as shown at 🔗31.

4.2.2.8 Autonomous underwater vehicles

An AUV is a self-propelled, unmanned, untethered, underwater vehicle capable of carrying out simple activities with little or no human supervision. Reasons for employing AUV range from the ability to obtain superior data quality (for example, obtaining high-resolution maps of the deep seafloor) to establishing a pervasive ocean presence (for example, using many small AUV to observe oceanographic fields) (Bellingham, 2009).

4.2.2.9 List of most relevant international in-situ data providers

Providers of international in-situ observations to be used for assimilation/validation are listed in Table 4.2.

ProviderDescriptionWebsite
WODWorld Ocean Database provides uniformly formatted, quality controlled, publicly available ocean profileshttps://www.ncei.noaa.gov/products/world-ocean-database
ArgoArgo provides data access to Global Data Assembly Centres in Brest (France) and in Monterey (USA)https://argo.ucsd.edu/about/status/
Copernicus Marine ServiceCopernicus Marine Service through the INS TAC for the operational pro visioning of near real time and reprocessed datasets used by the MFCs for assimilation and validationhttps://marine.copernicus.eu/
SeaDataNetSeaDataNet infrastructure, provides aggregated datasets (ODV collections of all unrestricted SeaDataNet measurements of temperature and salinity by sea basins) and climatologies (regional gridded field products) based on the aggregated datasets and data from external data sources such as the CORA and the WOD for all the European sea basins and the Global Oceanhttps://www.seadatanet.org/
EMODnetEuropean Marine Observation and Data Network is a long-term, marine data initiative funded by the European Maritime and Fisheries Fund which, together with the Copernicus space programme and the Data Collection Framework for fisheries, implements the EU’s Marine Knowledge 2020 strategy. EMODnet Physics provides a single point of access to validated in-situ datasets, products and their physical parameter metadata of European Seas and global oceans. More specifically, time series and datasets are made available, as recorded by fixed platforms (moorings, tide gauges, HF radars, etc.), moving platforms (Argo, Lagrangian buoys, ferryboxes, etc.) and repeated observations (CTDs, etc.)https://emodnet.ec.europa.eu/en     
https://emodnet.ec.europa.eu/en/physics

Table 4.2. List of most relevant international in-situ data providers.


4.2.3 Description of satellite observational oceanographic data

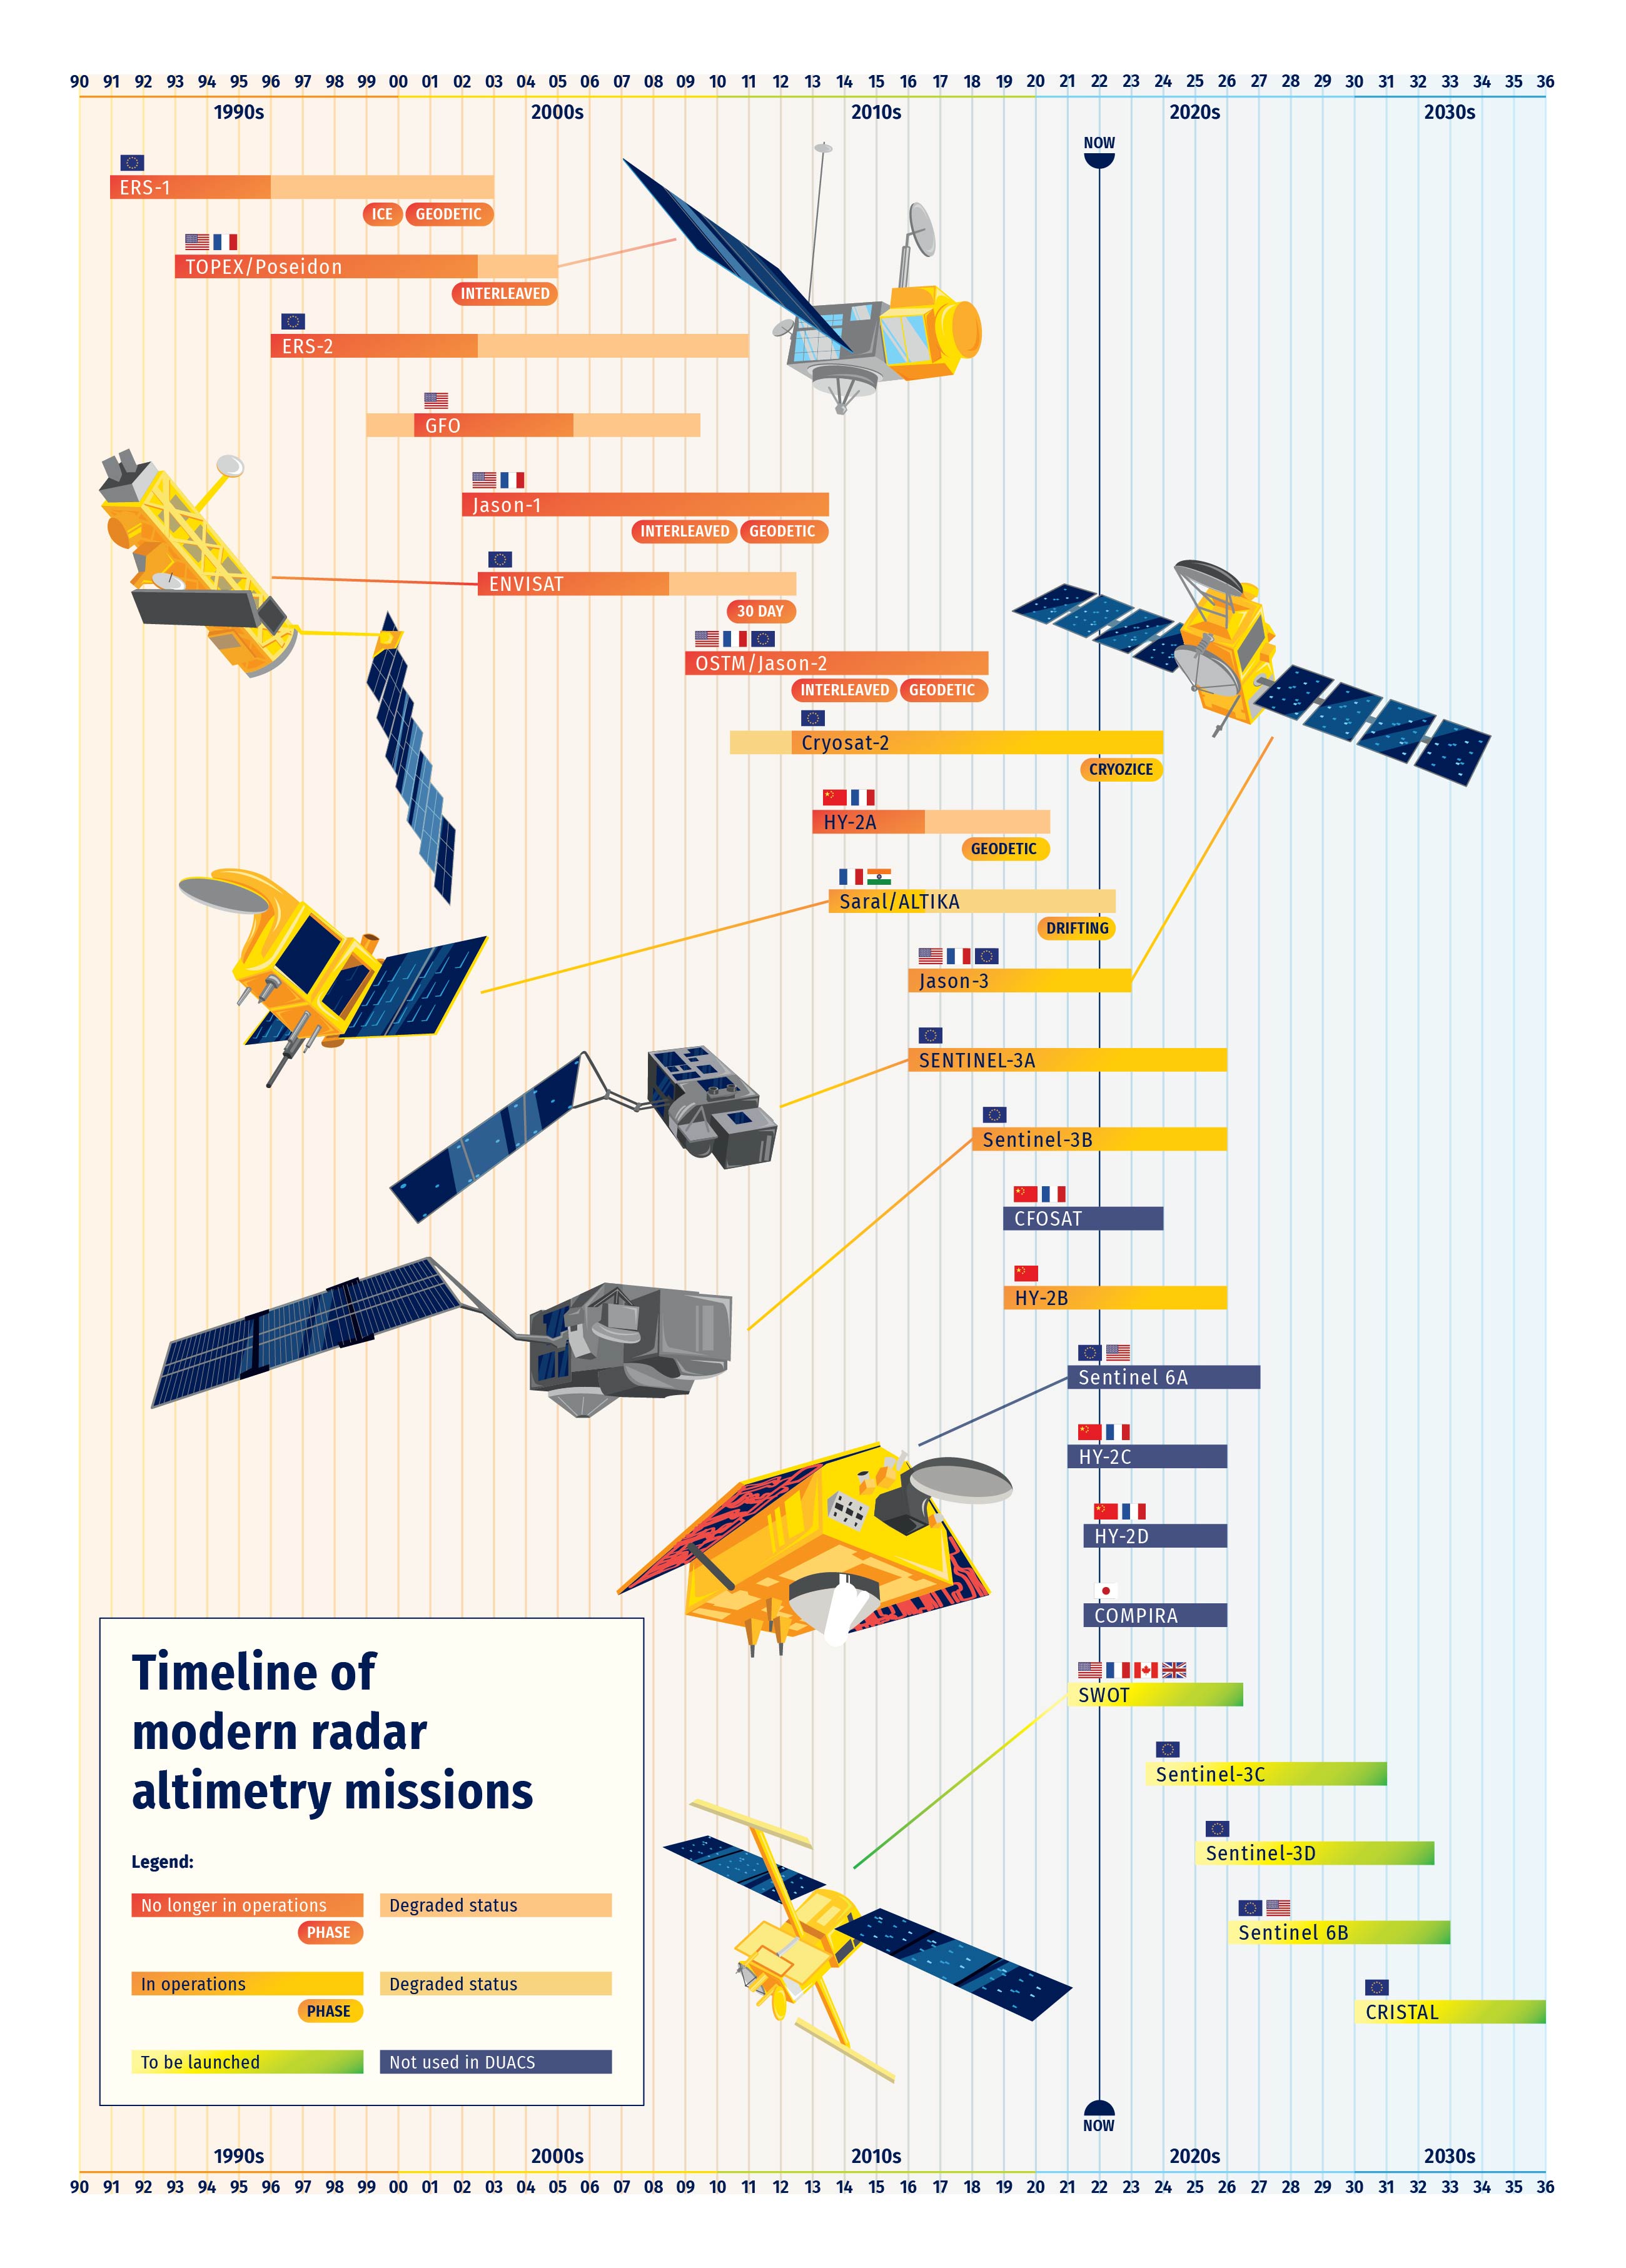
Satellite altimetry is one of the most important techniques for operational oceanography. Figure 4.12, adapted from International Altimetry Team (2021), shows an overview of the radar altimetry constellation and timeline as available from early 90’ and with a projection beyond 2030: it demonstrates how altimetry can be considered as a well-established Earth observation platform from space and its evolution contributes to scientific advances in ocean dynamics. Figure 4.12, in particular, reports the main international missions operational temporal framework: before 2020, we have a number of satellites that are not operational anymore (in orange) but that provide a huge and valuable source of historical observations. Then there are modern operational satellites for the provisioning of near real time altimetry data (in yellow): for some of them, the data provider is also able to report the degraded quality period. New missions (e.g., SWOT, Sentinel6) are planned to be launched starting from 2022. These missions should be able to provide very high quality and high resolution altimetry products (light yellow to green). Some of the operational satellite platforms are also part of the DUACS (in dark blue): these consist of a multi-mission merged dataset for measuring, in particular, ocean mesoscale dynamics (more details are also available at 🔗32).

Figure 4.12. Altimetry satellites timeline (adapted from International Altimetry Team, 2021).

Satellite altimetry has substantially advanced understanding of the oceans by providing unprecedented observations of the surface topography at scales larger than 200 km, thus increasing our knowledge of global ocean circulation from the role of mesoscale eddies in shaping ocean circulation to the global sea level rise. The following sections describe the variables measured by satellites.

4.2.3.1 Satellite sea surface temperature

The SST is another important data source for ocean data assimilation and monitoring oceanic conditions. Since the beginning of operational satellite SST observations in 1981, the number and diversity of sensors have increased dramatically and are still evolving (O’Carroll, et al. 2019). A combination of infrared - onboard both LEO and geostationary orbit platforms - and passive microwave (LEO only) radiometers provide a comprehensive global SST coverage to meet the minimum data specification to be used in operational ocean models (as defined by GODAE in Bell et al., 2009).

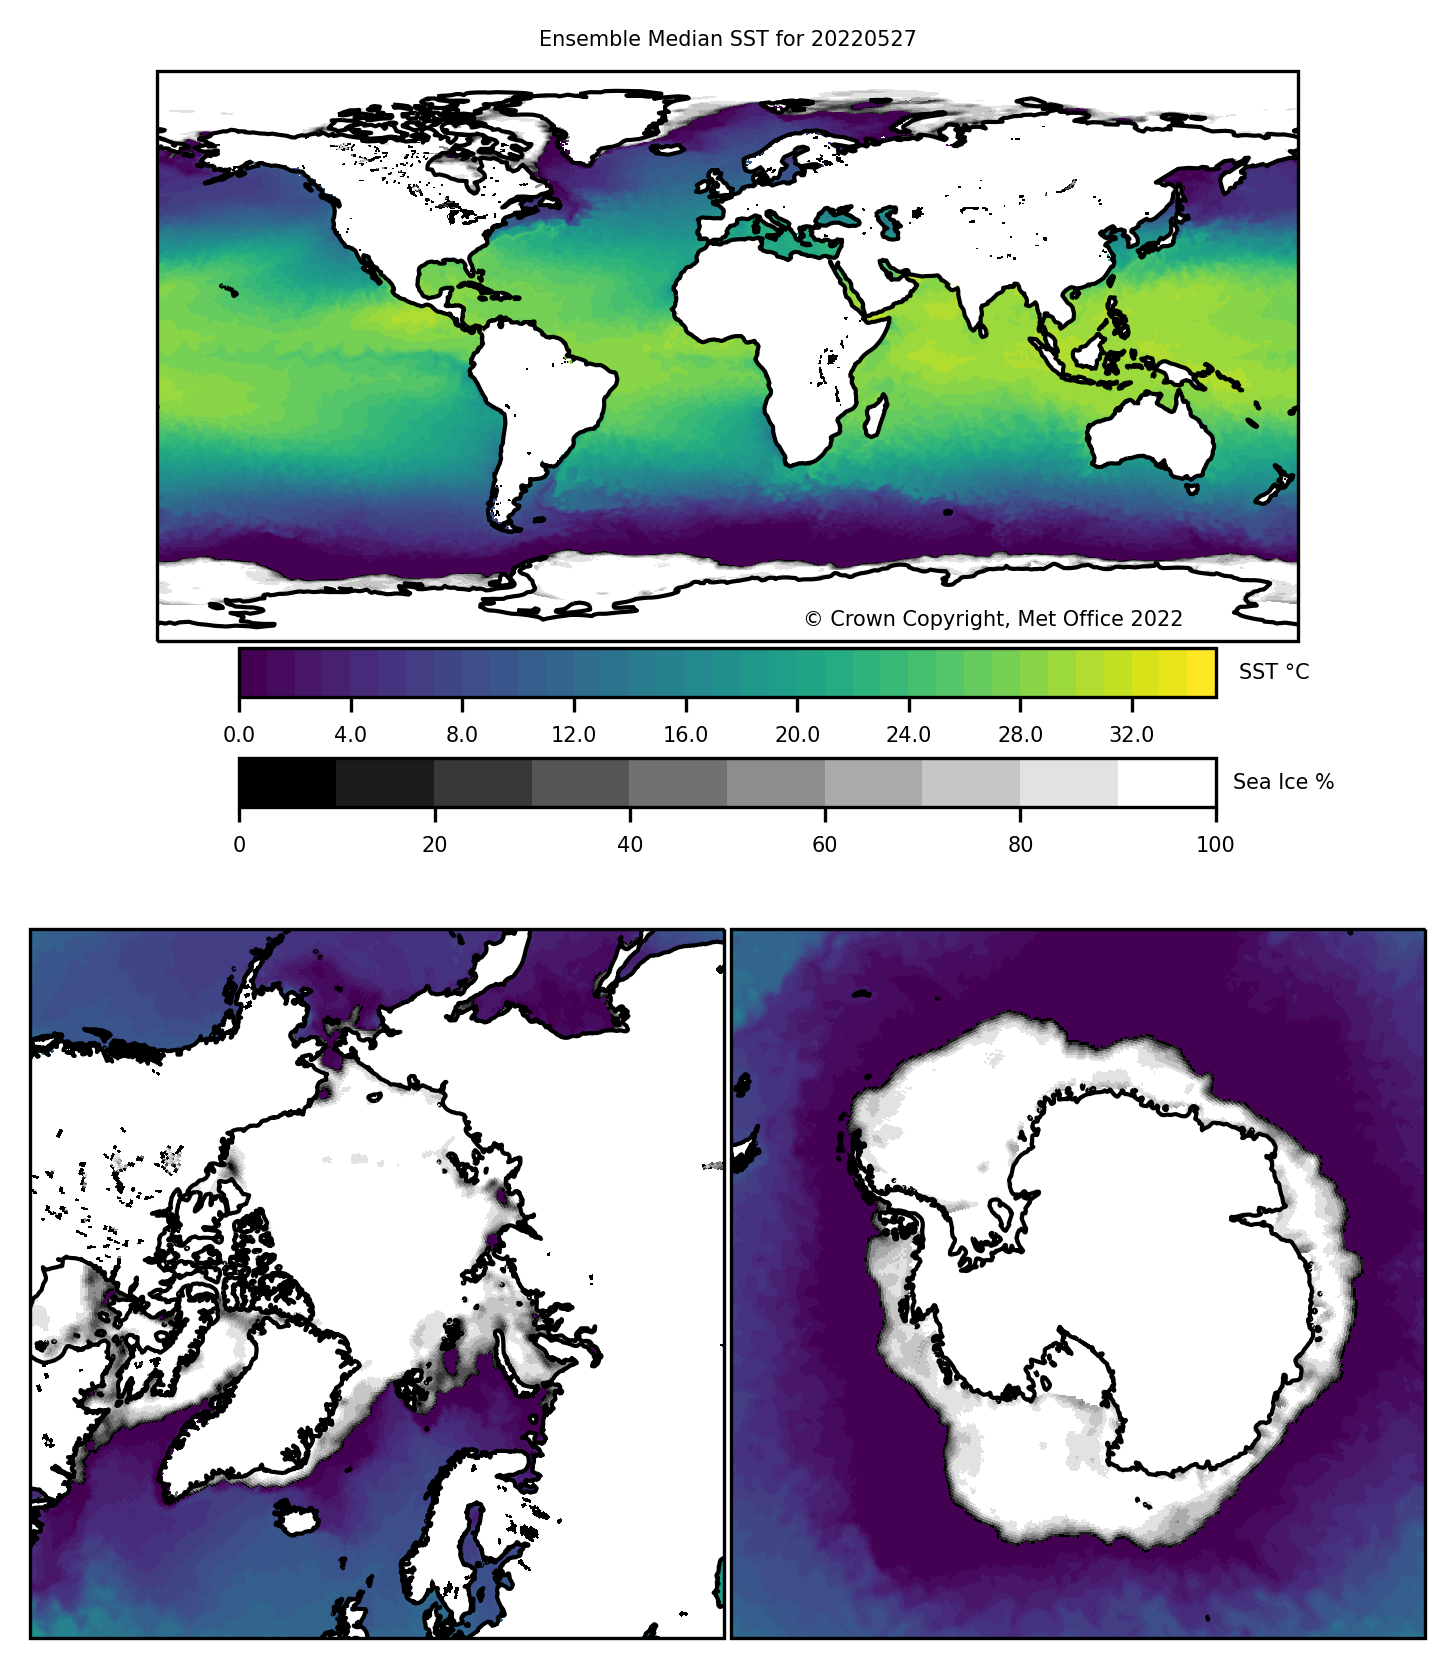
Most satellite SST observations assimilated into ocean prediction systems are processed in accordance with guidelines and formats specified by the GHRSST (Donlon et al., 2009); an example of a multi-product ensemble is shown in Figure 4.13.

Figure 4.13. Example of SST maps as provided by GHRSST multi-product ensemble - source: https://www.ghrsst.org/latest-sst-map/

GHRSST formatted products supply SST data either in satellite swath coordinates level 2 preprocessed (L2P) or level 3 composite (L3) gridded netCDF4 format files. L2P and L3 data products provide satellite SST observations together with a measure of uncertainty for each observation in a common GHRSST netCDF format (GHRSST Science Team, 2012). Auxiliary fields are also provided for each pixel as dynamic flags to filter and help interpret the SST data. These data are ideal for data assimilation systems or as input to analysis systems.

Gridding a single L2P file produces an “uncollated” L3 file (L3U). Multiple L2P files are gridded to produce either a “collated” L3 file (L3C) from a single sensor or a “super-collated” L3 file from multiple sensors (L3S) (source: 🔗34). There are a wide range of satellite SST products in L2P or L3 format provided by various GHRSST regional and data assembly centres. The following is a list of SST products from different satellite sensors that are common to many ocean prediction systems:

  • Passive Microwave Radiometers on LEO polar-orbiting satellites provide low spatial resolution SST at around 1 mm depth, with global coverage of the Earth at the equator up to twice daily and more frequently at higher latitudes. SST products obtained from passive microwave radiometers are effective at detecting ocean front variability in regions at least 50 km from land, under either clear or cloudy conditions but not precipitation. Most ocean prediction systems assimilate SST observations at ~25 km spatial resolution from the AMSR2 aboard the JAXA polar orbiting satellite. These data are made available via the JAXA EORC (🔗35) and Remote Sensing Systems (🔗36).
  • Infrared radiometers on LEO satellites provide high spatial resolution SST at around 10 micrometer depth, with global coverage of the Earth under clear sky conditions up to twice daily at the equator and more frequently at higher latitudes. SST products commonly used are measured by the Advanced Very High-Resolution Radiometer (AVHRR) instrument flown by the Meteorological Operational satellite (MetOp) series of polar-orbiting environmental satellites launched by the ESA and operated by the EUMETSAT. Two types of AVHRR SST products used in ocean prediction systems are: 1) the 1.1 to ~4 km spatial resolution FRAC AVHRR L2P and 2) the 4.4 to ~18 km resolution GAC AVHRR L2P, produced by the OSI SAF within EUMETSAT (🔗37), OSPO (🔗38), and NAVOCEANO. The NAVOCEANO FRAC and GAC AVHRR L2P SST data are made available under the MISST (🔗39) project sponsor-ship by the ONR and the PO.DAAC (🔗40) operated by the NASA JPL. The newest NOAA JPSS satellites (Suomi-NPP and NOAA-20) are now equipped with the VIIRS sensors, that have a wide range of infrared channels, and provide SST at 0.75 km to 1.5 km resolution. In order to facilitate ingestion into real-time operational ocean systems, the VIIRS level 3 Uncollated (L3U) data are produced by the NOAA OSPO (🔗41), and publicly available from NOAA OceanWatch (🔗42) and PO.DAAC.
  • Infrared radiometers on geostationary satellites above the equator provide high spatial (2~5 km) and temporal (10~60 minute) resolution SST observations over a fixed geographic region. There are several GEO satellites distributed around the equator and operated by different agencies (i.e. ESA, ISRO, NOAA, JMA, JAXA, KMA and CMA); they provide high temporal resolution SST that can improve clear-sky masking by using temporal information to separate the effects of faster moving clouds and other atmospheric features from the slower evolving SST fields (O’Carroll et al., 2019). One example is the AHI sensor of the JMA geostationary satellite “Himawari-8”, which allows relatively high frequency measurement of SST (every 10 minutes with horizontal resolution ~2 km) in a wide area of the Western Pacific (Kurihara et al., 2016). Data are made available by JAXA (🔗43), NOAA (🔗44) and the Australian Bureau of Meteorology via the National Computational Infrastructure (🔗45). 

Surface diurnal warming events occur in ocean regions of high solar radiation, clear skies, and calm seas. They are more common in the tropics (Zhang et al., 2016) but have also been observed at high latitudes (Eastwood et al., 2011). The warming events produce near-surface thermal gradients that create daytime near-surface or warm-layer temperatures up to 2-4°C warmer than nighttime (Donlon et al., 2002). Some operational centres exclude daytime satellite SST observations to reduce the diurnal warm bias and only use night-time satellite SST to assimilate into ocean analyses and forecast models. Most GHRSST L2P or L3U format SST data are corrected for bias by subtracting the SSES bias value associated with each SST value (GHRSST Science Team, 2012), derived by data providers using recent matchups with SST observations from drifting buoys and tropical moorings (Petrenko et al., 2016) that produce SST estimates at around 0.2 m depth.

4.2.3.2 Satellite Altimeter

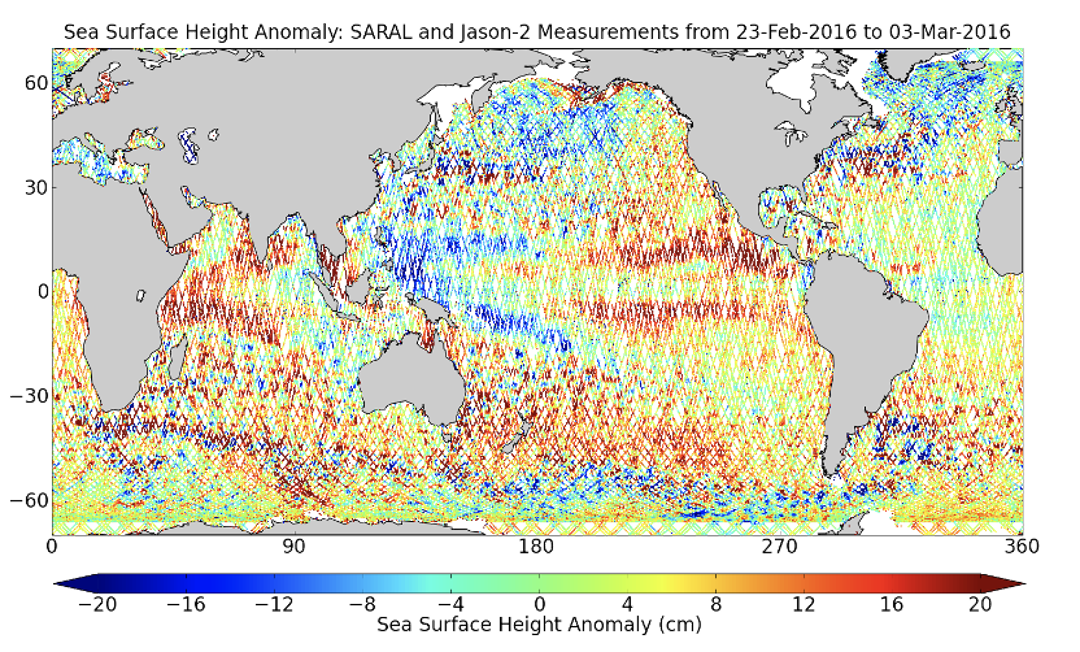
The main parameter that can be derived from satellite altimeters is SLA relative to a reference mean dynamic topography. SLA is fundamental for sea level monitoring and ocean data assimilation. Two freely available common data sources for real-time altimetry data retrieval are the RADS - which was developed by the DEOS and the NOAA Laboratory for Satellite Altimetry (Naeije et al., 2000; Scharroo, 2012) - and the Copernicus Marine Service (Figure 4.14).

Figure 4.14. Global ocean along track sea level anomaly - source: https://datastore.cls.fr/products/

The DEOS is building and developing the RADS database that incorporates validated and verified altimetry data products. The database is consistent in accuracy, correction, format and reference system parameters. The capability of such a database has attracted users with less satellite altimeter expertise. Currently, RADS enables users to extract the data from several present and past satellite altimeter missions like GEOSAT, ERS1, ERS2, ENVISAT, TOPEX/Poseidon (T/P), JASON1, JASON2, JASON3, CRYOSAT2, SENTINEL-3A, and SARAL 🔗46

The Level 3 SLA product from Copernicus Marine Service is another open accessible data source for SLA. It shares many of the most useful features of the RADS service, including adaptation to changes in the available satellite fleet and maintaining homogeneity. Although superficially RADS and Copernicus Marine Service seem providing the same type of SLA observation they are not identical and a detailed explanation of differences is non trivial, as the RADS data includes many of the corrections used by Copernicus Marine Service, as well as the corrections applied in its own processing. Users are encouraged to explore the differences between these two data streams and choose the suitable satellite altimeter data source for their own data assimilation system.

4.2.3.3 Satellite Sea Surface Salinity

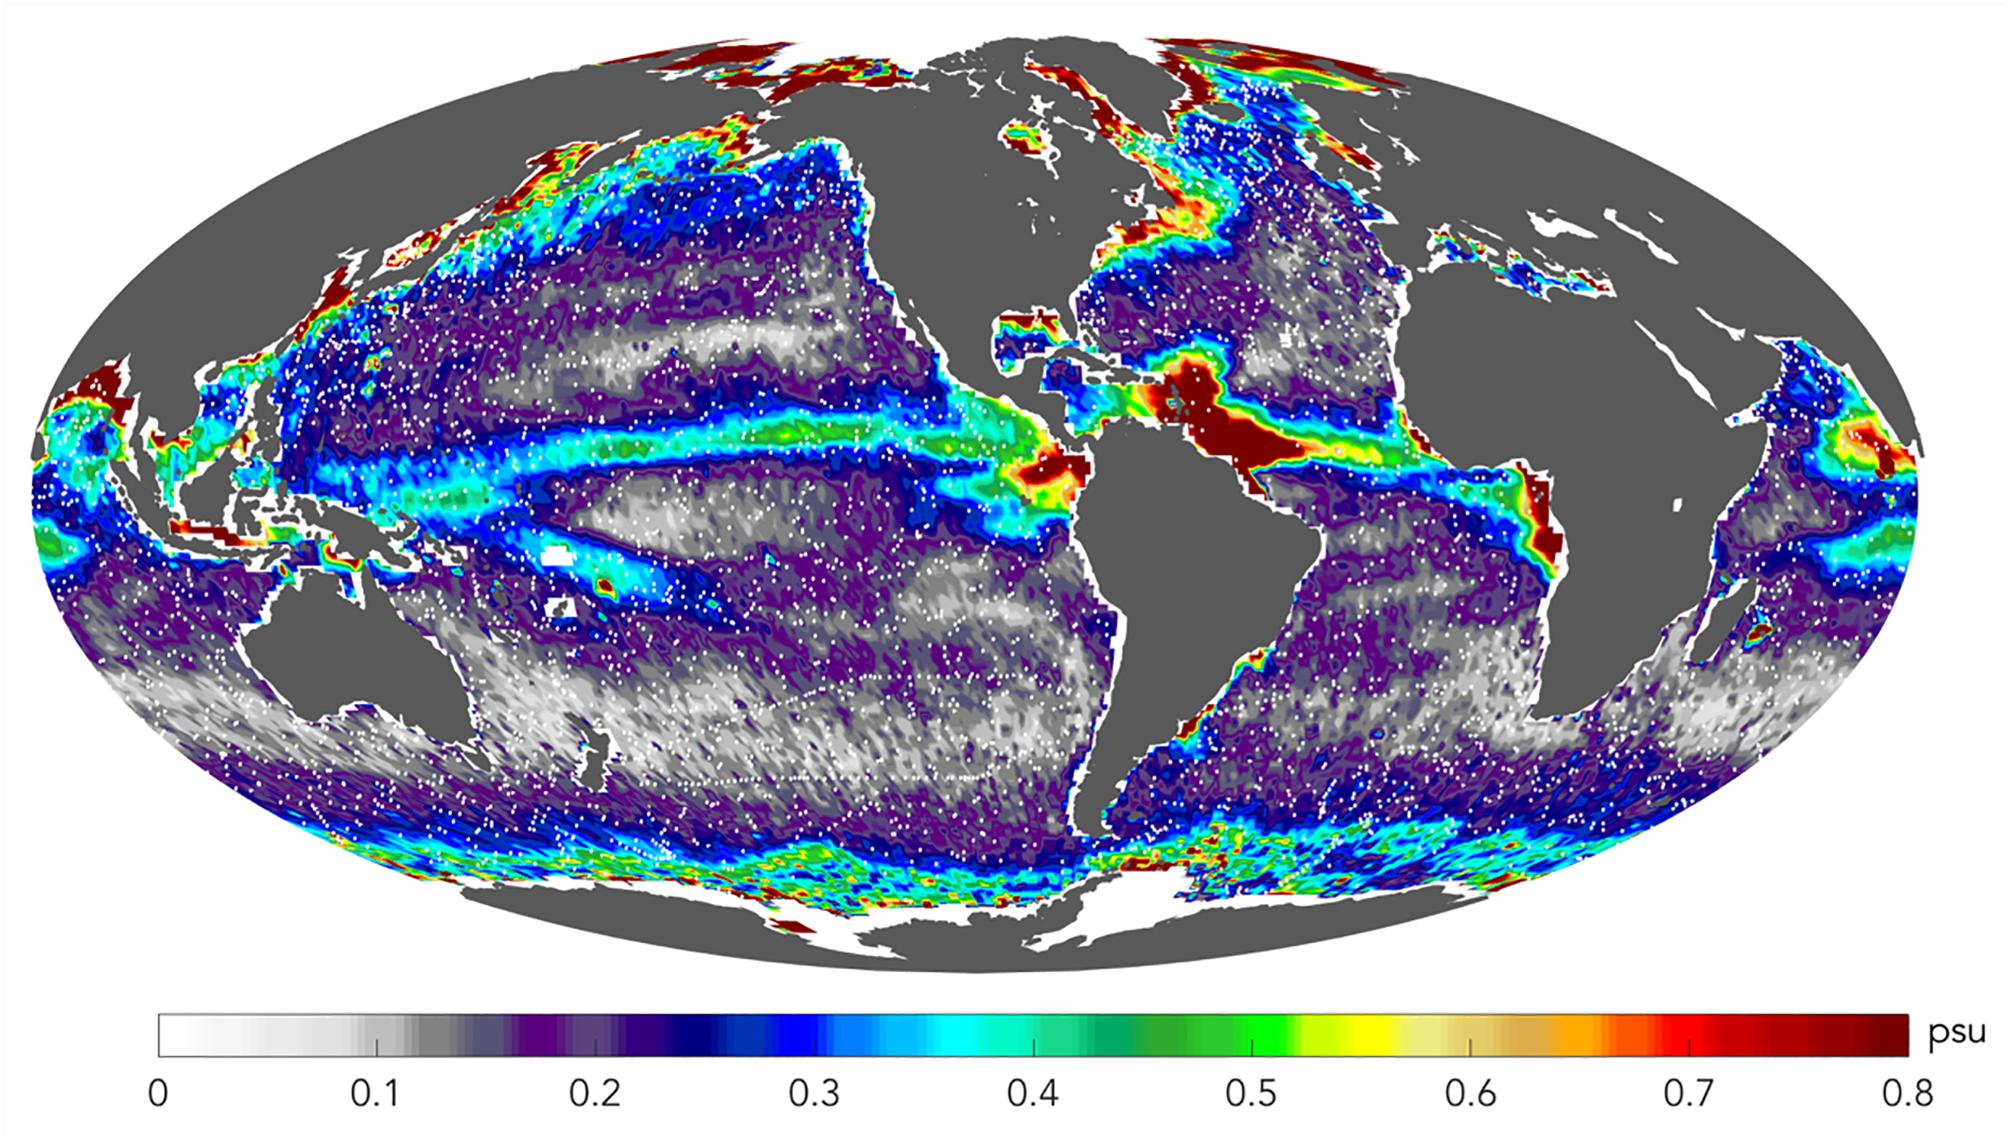
Measuring SSS from space is a relatively recent technique that relies on L-band radiometry (which has evolved to a point where useful information is provided every few days). Satellite SSS offers the advantages of global coverage and the ability to capture space and time scales not afforded by in-situ platforms such as vessels, moorings, and Argo profiling floats. Figure 4.15 shows a year of satellite SSS products from the ESA’s SMOS and NASA Aquarius and SMAP missions. It is worth noting that regions of high variability of >0.2 psu - including coastal oceans, western boundary currents, the Indonesian Seas, and the Southern and Arctic Oceans - are either not sampled or poorly sampled by Argo (Vinogradova et al., 2019).

Figure 4.15. Variability in space-borne sea surface salinity during one year (colors) superimposed with locations of currently operational Argo floats (white dots) from Vinogradova et al. (2019).

Level 3 observations (L3 - provided on a grid but with no in-filling) with various temporal and spatial averaging from the SMOS, Aquarius, and SMAP satellites are available, as are level 2 data (L2; SSS values at the native swath resolution). For SMOS and Aquarius, L3 products are available daily, with separate files for the ascending and descending parts of the orbit. The products used are from the LOCEAN (🔗48) and the JPL (🔗49) respectively for SMOS and Aquarius. While there is a daily L3 SMAP product, it is based on observations from an 8-day period that would require a complicated observation operator in the data assimilation. The availability of SSS from SMOS, Aquarius and SMAP has enabled ocean forecast validation (e.g., Vinogradova et al., 2014; Martin, 2016). In recent years, efforts have been put into assimilating satellite SSS data, which is challenging for several reasons. Largely, these are related to the magnitude of errors in the data, particularly in the SSS products needed for operational-style forecasting systems that are required at high temporal resolution (Martin et al., 2019). Quality control of satellite SSS has proved to be a very important process for ocean data assimilation.

4.2.3.4 Satellite sea ice

The sea ice concentrations from Nimbus-7 SMMR sensor and DMSP SSM/I passive microwave data, are accessible from the NASA NSIDC DAAC (🔗51) (Figure 4.16). This sea ice concentration dataset is generated from brightness temperature data and is designed to provide a consistent time series of sea ice concentrations spanning the coverage of several passive microwave instruments. The data are provided in the polar stereographic projection at a grid cell size of 25 x 25 km. This is then interpolated to 10 km resolution, level 3 composite of SSMIS level 2 data, on a polar stereographic grid (🔗52). Daily files are available within 24-48 hours after last satellite acquisition. 

Figure 4.16. Example of satellite-based product for sea ice extension in the Northern Hemisphere - source: https://earth.gsfc.nasa.gov/cryo/data/current-state-sea-ice-cover

The same satellite sea ice concentration data originating from NSDIS SSM/I aboard the DMSP series of polar-orbiting sun-synchronous satellites, are provided by the OSI SAF (🔗53). The global daily sea ice concentration is processed by OSI SAF at 10 km resolution as level 3 composites of SSMIS level 2 data on a Polar Stereographic grid. Northern Hemi-sphere and Southern Hemisphere daily files are available within 6 hours after last satellite acquisition.

4.2.3.5 Ocean Colour

Ocean colour measurement consists of detecting spectral variations in the water-leaving radiance (or reflectance), which is the sunlight backscattered out of the ocean after interaction with water and its constituents (Groom et al., 2019). This is a very significant measurement for the monitoring of ocean water quality, ocean acidification, or to understand the global carbon cycle, apart from using it for assimilation and validation. In the open ocean, the signal is largely influenced by the presence of phytoplankton and dissolved organic matter; in coastal waters, it is also influenced by resuspended particulate matter and river runoff that transports other kinds of anthropogenic particulate. In the framework of the Copernicus Marine Service, two types of products are delivered by the OC TAC (54🔗):

  • CHL is the phytoplankton chlorophyll concentration. For the global and regional seas, OC TAC selected the state-of-the-art product algorithm on the basis of optical characteristics of the basin and round robin procedure. For the regional seas, daily chlorophyll fields are produced by applying two different algorithms for open ocean (Case I) and coastal waters (Case II). The data are then merged into a single chlorophyll field providing a regional product with an improved accuracy of estimates in coastal waters.
  • The OPTICS product includes all other variables retrieved from ocean colour sensors: IOP, such as absorption and scattering, the diffuse attenuation coefficient of light at 490 nm (Kd490), Secchi depth (transparency of water), spectral Rrs, PAR, CDOM, and the SPM.

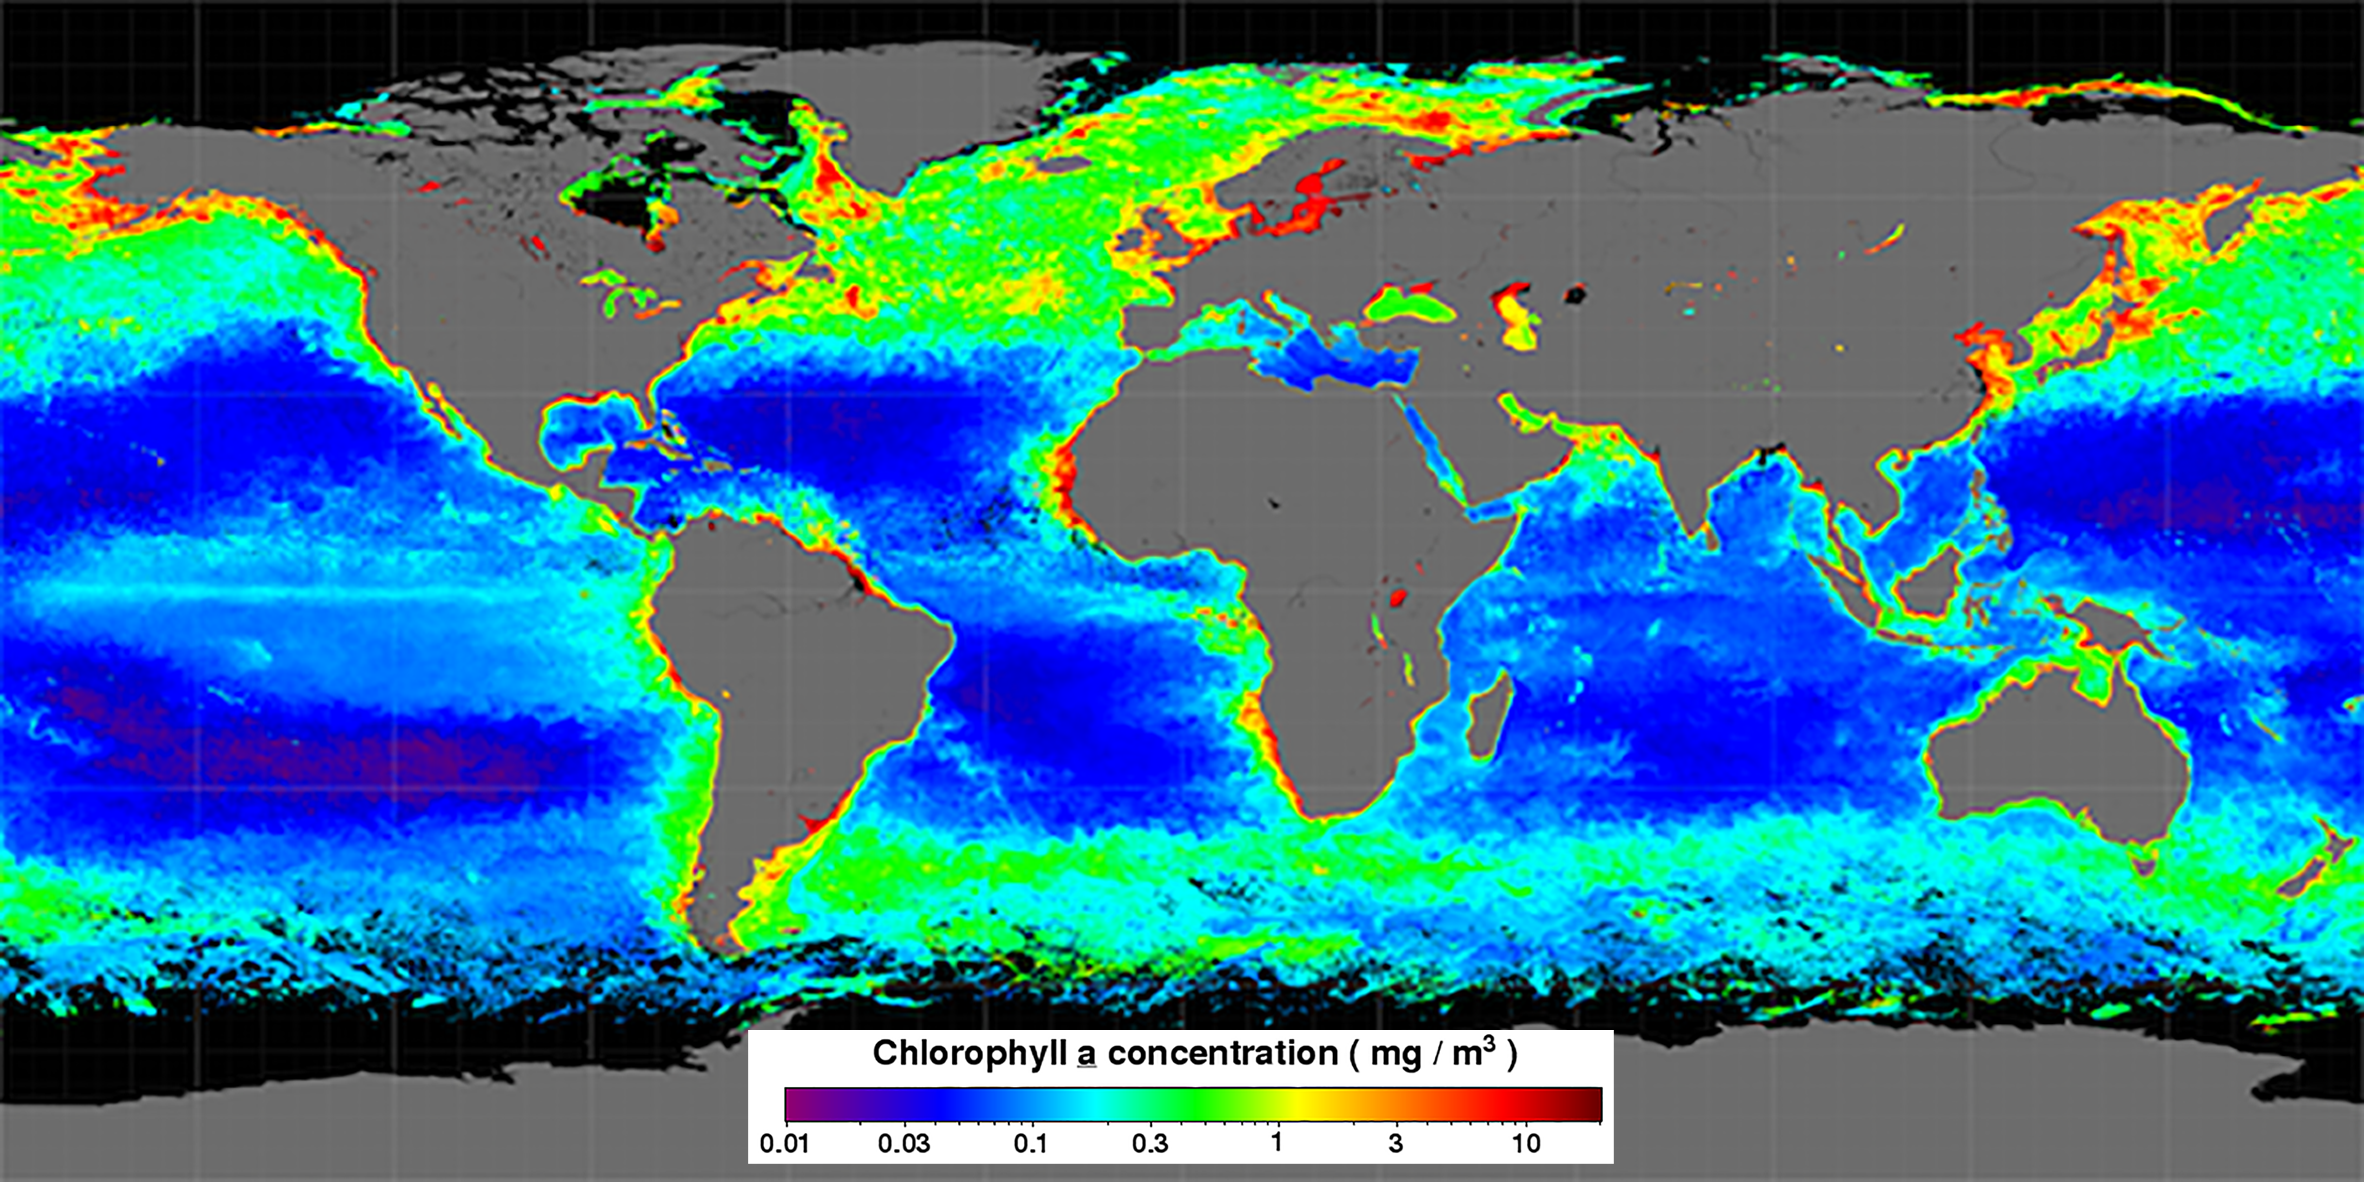
Figure 4.17 shows an example of chlorophyll concentration at global scale from the MODIS Aqua satellite.

Figure 4.17. MODIS Aqua chlor_a seasonal composite for Spring 2014 - source: https://oceancolor.gsfc.nasa.gov/

4.2.3.6 Significant Wave Height

The SWH (or Hs) is the average wave height (from trough to crest) of the highest third (33.33%) of the waves in a given sample period. The Sentinel-3 mission is able to monitor wave heights from 0 to 20 m. The marine sea state SWH product is a critical product for all maritime safety and rescue operations (from 🔗57).

Figure 4.18 shows an example of SWH for the global ocean from Sentinel-3A measurements.

Figure 4.18. Sentinel-3 SRAL significant wave height Level-2 global map - source: https://www.eumetsat.int/

4.2.3.7 Providers of satellite data

Providers of satellite observations to be used for assimilation/validation are listed in Table 4.3.

ProviderDescriptionWebsite
Copernicus Marine ServiceCopernicus Marine Service through the SL, SST, OC, WAVE TACs for the operational provisioning of near real time and reprocessed datasets used by the Monitoring and Forecasting Centres (MFCs) for assimilation and validationhttps://marine.copernicus.eu/
GHRSSTThe Group for High-Resolution Sea Surface Temperature (SST) (GHRSST) provides a new generation of global high-resolution (<10km) SST products to the operational oceanographic, meteorological, climate and general scientific communityhttps://www.ghrsst.org/
AVISO++AVISO++ provides altimeter datahttps://www.ghrsst.org/
EUMETSATEUMETSAT is the European operational satellite agency for monitoring weather, climate and the environment from space. In particular, it provides SST and altimeter datahttps://www.eumetsat.int/
NOAA NSIDCNOAA National Snow and Ice Data Centre provides sea ice concentration in the polar regionhttps://nsidc.org/

Table 4.3. List of most relevant international satellite data providers.


4.2.4 Bathymetry

The term “bathymetry” refers to the ocean’s depth relative to the sea level. It is an important element in any ocean model, since it allows us to represent the geographical and topographical peculiarities of the sea floor. It has a strong influence on the circulation, notably its barotropic and depth-integrated features, in particular (but not only) at sills and straits, on coastal and in shelf seas. For this reason, its accuracy may determine the goodness of the ocean model, although there are issues of smoothing and grid mislocation that need to be considered and solved by using ad hoc spatial analysis.

A bathymetric dataset needs to be interpolated onto the model’s grid. Pre-processing of the bathymetric fields should be necessary for numerical reasons: since bathymetry datasets are usually finer than the model grid, they may need to be smoothed before inserted on the model grid. Effective resolution and vertical coordinates of the ocean model could also constrain the smoothness of the bathymetry.

Figure 4.19 shows an example of a bathymetric dataset as provided by EMODnet bathymetry.

Figure 4.19. An example of a bathymetric dataset: the EMODnet bathymetry - source: https://emodnet.ec.europa.eu/en/bathymetry

Table 4.4 includes a list of public providers of bathymetric datasets (Marks and Smith, 2006).

ProviderDescriptionWebsite
DBDB2Digital Bathymetric DataBase at 2 min by 2 min uniform grid global bathymetry and topography data developed for the ocean model. It was developed by the Naval Research Laboratoryhttps://www7320.nrlssc.navy.mil/DBDB2_WWW/
ETOPO11 arc-minute global relief model of Earth’s surface that integrates land topography and ocean bathymetry. It was built from numerous global and regional data sets. Historic ETOPO2v2 and ETOPO5 global relief grids are depreciated but still availablehttps://www.ncei.noaa.gov/products/etopo-global-relief-model
GEBCOGridded Bathymetry Data for the World’s oceans at 15 arc-second resolution. It operates under the joint auspices of the IHO and the UNESCO IOChttps://www.gebco.net/
SRTM+Global bathymetry and topography. SRTM15+ is the last version at 15 arc-second resolution, built upon the latest compilation of shipboard sounding and satellite-derived predicted depths. V2.0 is part of the last release of GEBCO_2020 (Tozer et al., 2019)https://topex.ucsd.edu/marine_topo/
EMODnet BathymetryIt is part of the EMODnet project, funded by the European Commission, which brings together marine data into interoperable, continuous and publicly available bathymetric dataset for all the maritime basins in European waters and for the global oceanhttps://emodnet.ec.europa.eu/en/bathymetry

Table 4.4. Bathymetric dataset products and providers.


4.2.5 Atmospheric forcing

Typically, NWPsystems provide atmospheric surface forcing fields to OOFS in order to compute water, heat, and momentum fluxes. Such fields may be also supplemented by real-time or near real-time observations and other averaged datasets including climatology. Certainly, in a more complex modelling framework, an ad hoc atmospheric model can be resolution of the ocean model in order to provide high resolution atmospheric fields (coupled systems, see Chapter 10 for further details).
In general, typical surface data input required by an OOFS that is provided by an NWP model includes:

  • Sea ice coverage;
  • Downward surface longwave radiation;
  • Upward surface longwave radiation;
  • Downward surface shortwave radiation;
  • Upward surface shortwave radiation;
  • Dewpoint depression at 2 m;
  • Surface latent heat;
  • Mean sea level pressure;
  • Surface sensible heat;
  • Specific humidity at 2 m;
  • Air temperature at 2 m;
  • Cumulative precipitation rates;
  • Zonal and meridional wind components and wind speed at 10 m (or surface wind stresses);
  • Short-wave radiation heat flux penetrating through ice; 
  • Ice freezing/melting heat flux;
  • Zonal and meridional ice stress on ocean;
  • Sea-Ice basal salt flux.

The above list is not exhaustive and inputs can vary based on the needs of the OOFS. For example, it can be used SST from the OOFS along with the air temperatures at 2 m to calculate sensible heat flux instead of using that provided by NWP. More details on thermodynamic and momentum forcing of the ocean can be found in Barnier (1998), Barnier et. al.(1995), Josey et al. (1999).

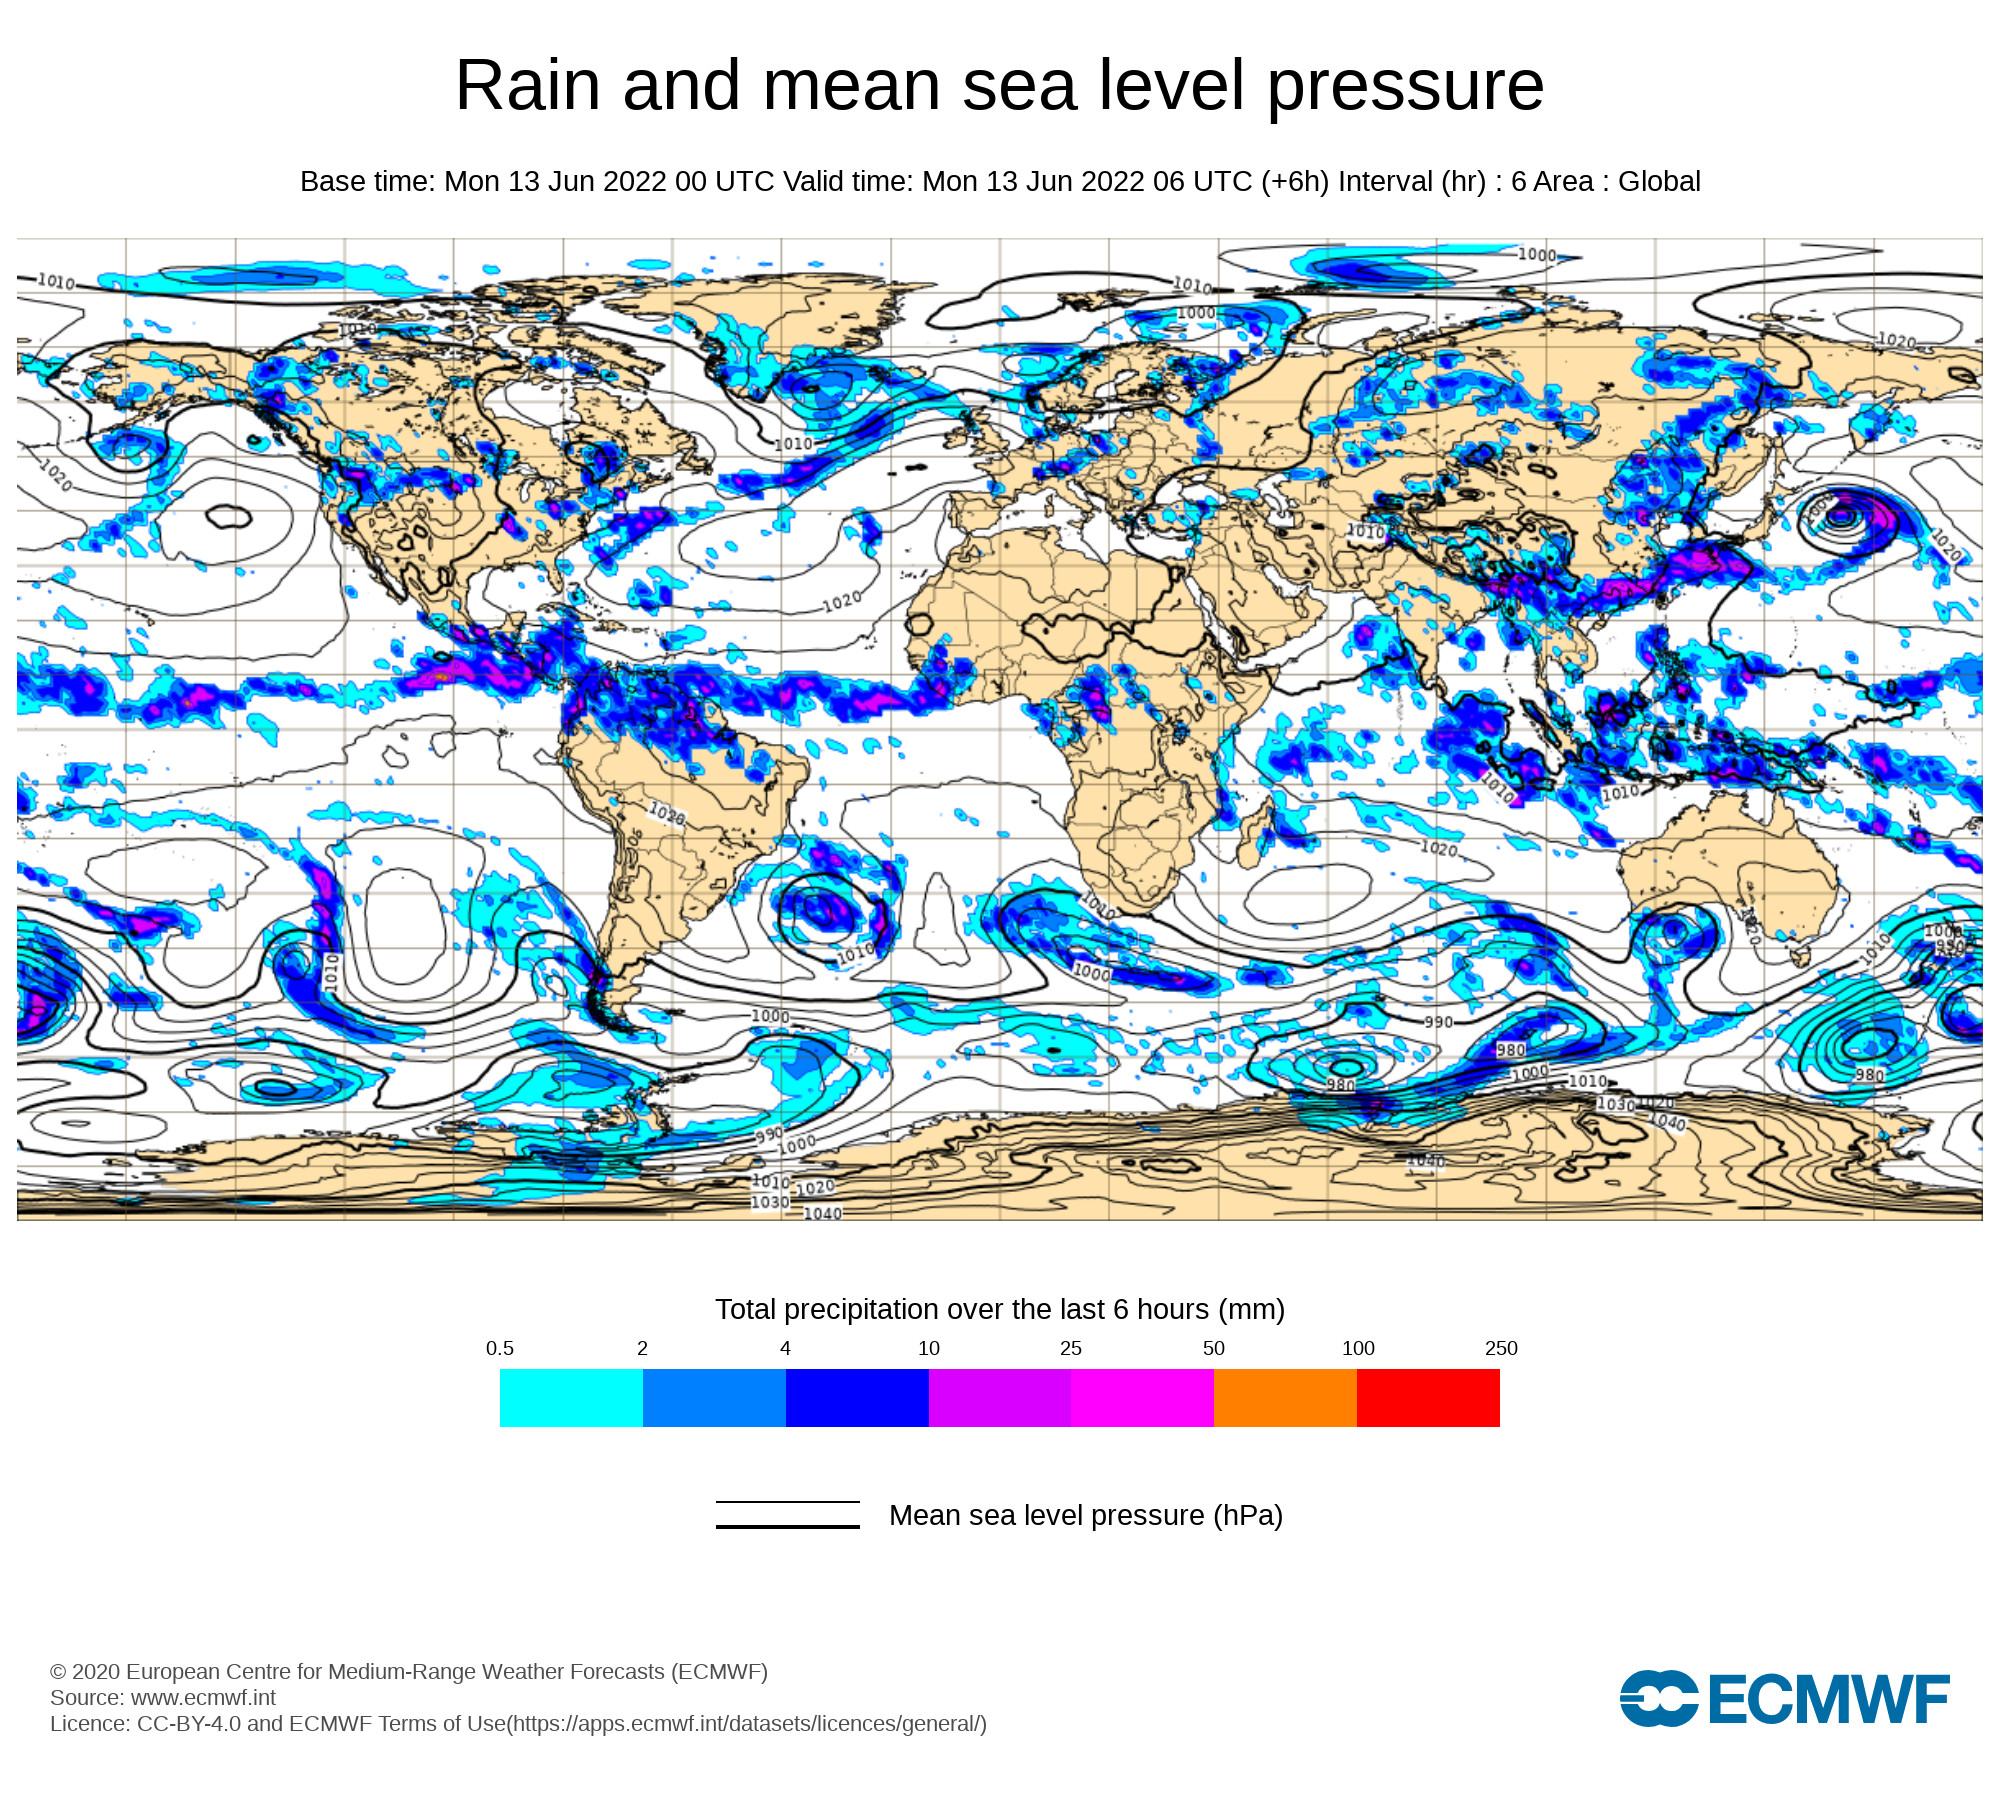
Figure 4.20 shows an example of surface forcing atmospheric fields from the ECMWF IFS.

Figure 4.20. An example of surface forcing fields: rain and mean sea level pressure at global scale from ECMWF - source: https://www.ecmwf.int/


A list of global NWP systems is provided in Table 4.5.

DatasetDescription Provider
GFSGlobal Forecast System, produced by the National Centers for Environmental Prediction (NCEP), provides analysis and forecast atmospheric fields for the global ocean at the resolution of about 28 kmhttps://www.ncei.noaa.gov/products/weather-climate-models/global-forecast
NAVGEM Navy Global Environmental Model runs by the United States Navy’s Fleet Numerical Meteorology and Oceanography Center (FNMOC)https://www.cnmoc.usff.navy.mil/usno/
ECMWF IFS
and ERA5
European Center for Medium range Weather Forecasting that provides reanalysis, analysis and forecast atmospheric fields at medium, extended, and long rangehttps://www.ecmwf.int/
Met Office
UK
United Kingdom Meteorological Office that produces the Unified Model, a numerical model of the atmosphere used for both weather and climate applicationshttps://www.metoffice.gov.uk/
GEMGlobal Environmental Multiscale model, an integrated forecasting and data assimilation system developed in the Recherche en Prévision Numérique (RPN), Meteorological Research Branch (MRB), and the Canadian Meteorological Centre (CMC)https://collaboration.cmc.ec.gc.ca/

Table 4.5. Atmospheric forcing products and providers.


4.2.6 Land forcing

Rivers represent the natural element connecting land and ocean through the coastline. They impact both coastal and basin-wide circulation and dynamics through net freshwater flux; additionally, they are responsible for biotic diversity and eutrophication, particularly in coastal waters.

Water discharges, nutrients, and organic materials represent sources of freshwater and biogeochemical fluxes for an OOFS, and we have to account for them once we set a numerical model. This kind of data may come from observations or from other models (hydrological or biogeochemical models). In particular, information about discharge, and possibly also salinity and temperature if available, should be provided for the river mouth at given coordinates.

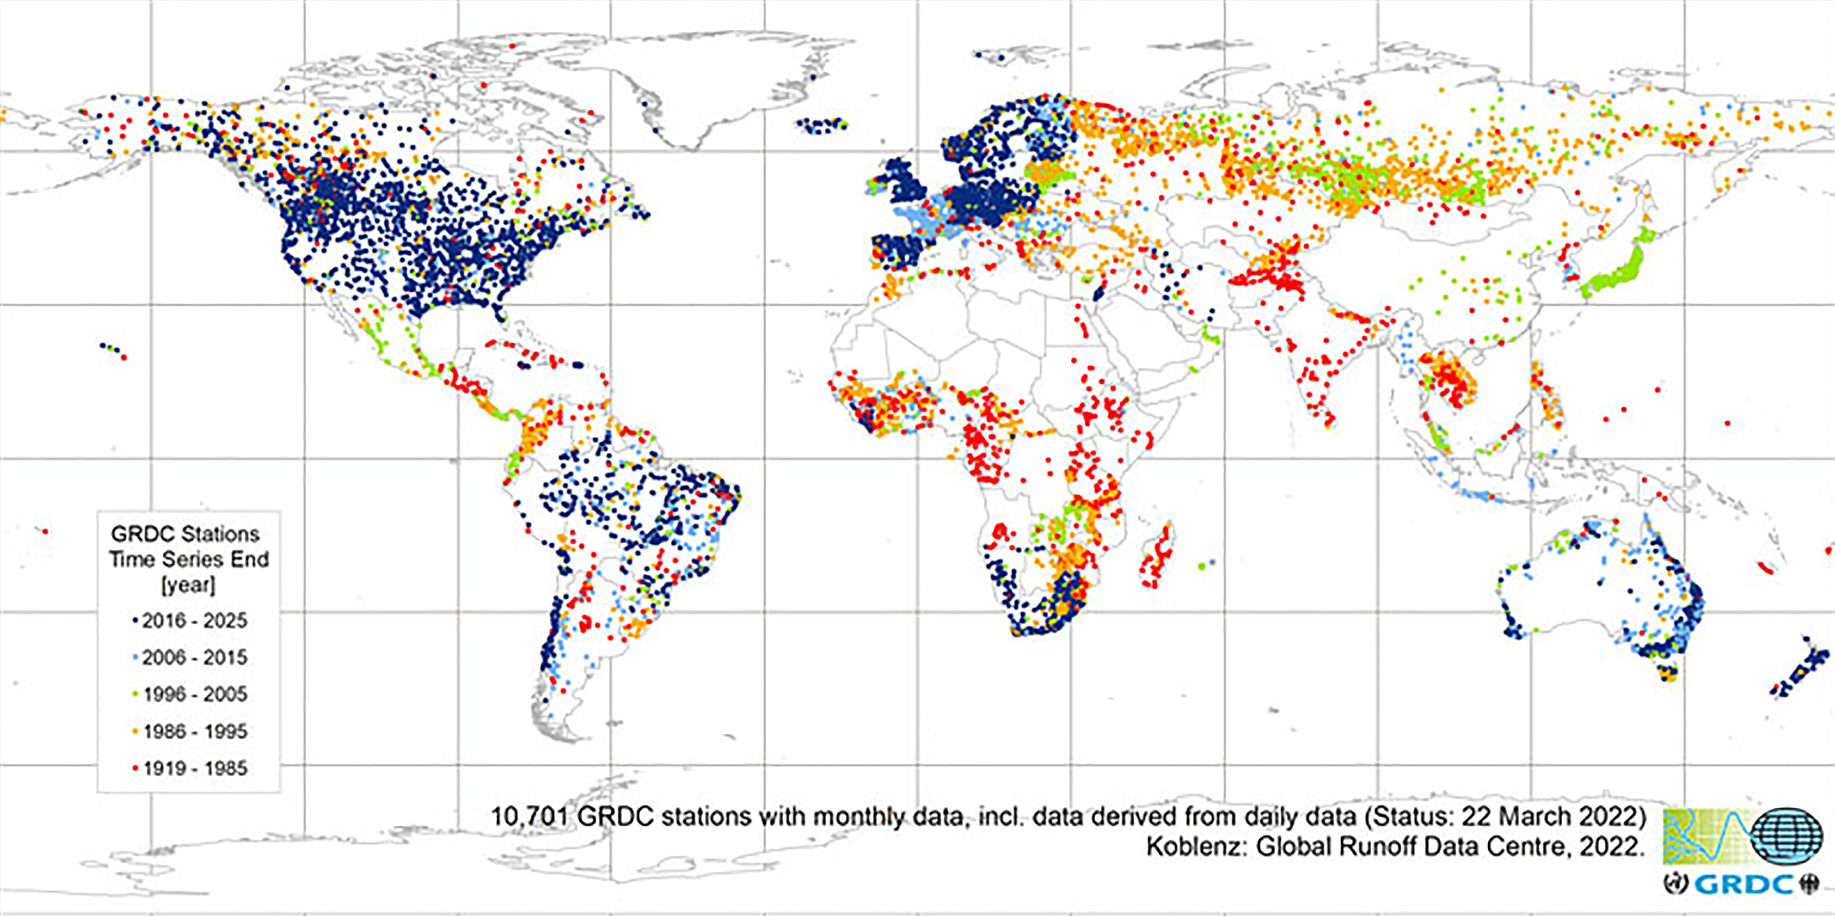
As an example, in Figure 4.21 is shown the distribution at global scale of stations that operated/are operating in a certain temporal period contributing to the GRDC. 

Figure 4.21. An example of river runoff discharge data provider: worldwide distribution of stations contributing to GRDC - source: https://www.bafg.de/GRDC/EN/Home/homepage_node.html


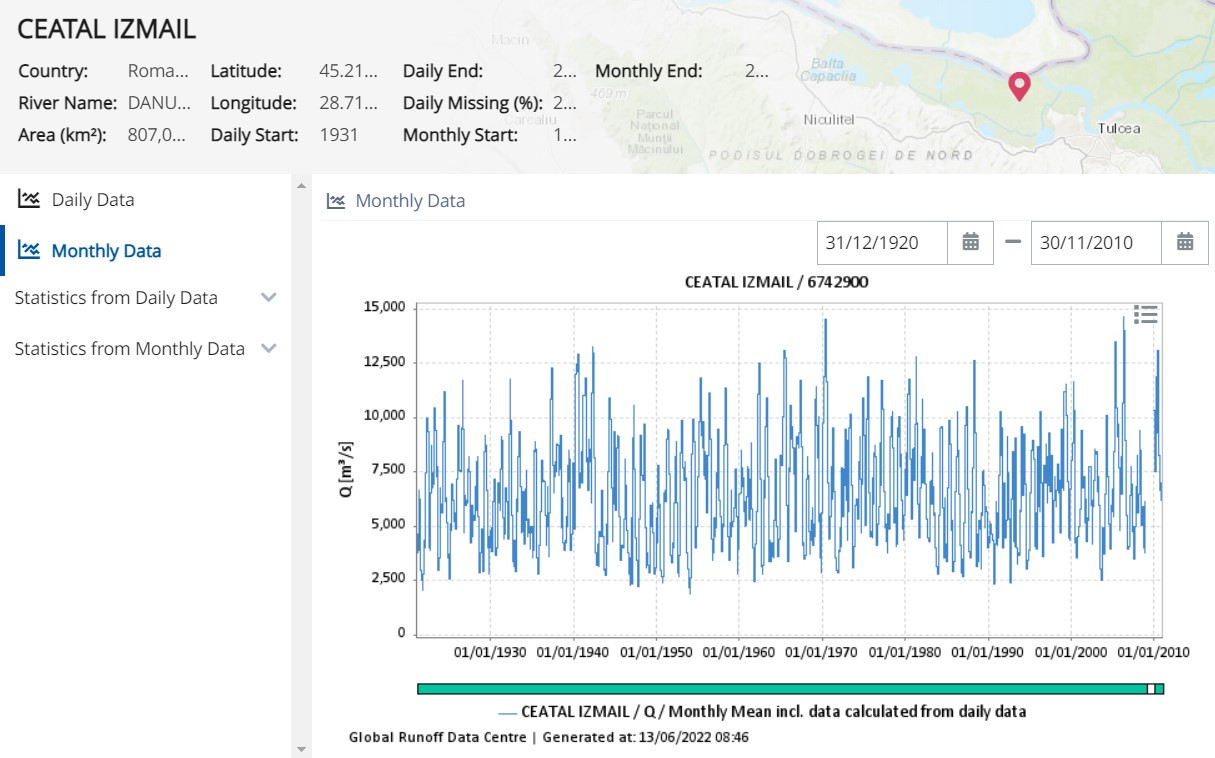
Once the user selects one of the stations, the web service returns the water discharge timeseries (Figure 4.22) allowing to download and integrate it as an input dataset in the ocean model setup.

Figure 4.22. An example of river runoff discharge (monthly data) time series from GRDC related to Ceatal Izmail station (Romania) that monitors the Danube basin - source : https://www.bafg.de/GRDC/EN/Home/homepage_node.html


Table 4.6 provides a list of international databases for river data.

DatasetDescriptionProvider
GRDCGlobal Runoff Data Base, built on an initial dataset collected in the early 1980s from the responses to a WMO request to its member countries to provide global hydrological informationhttps://www.bafg.de/
Dai and 
Trenberth
Dai and Trenberth Global River Flow and Continental Discharge Dataset contains time series of all available monthly river flow rates observed at the farthest downstream station for the world’s largest 925 rivers, plus long-term mean river flow rates and continental discharge into the individual and global oceans, produced originally by Dai and Trenberth (2002) and Dai et al. (2009) and Dai (2021)https://rda.ucar.edu/datasets/ds551.0
EFASEuropean Flood Awareness System developed and operational within the Copernicus Emergency Management Service. It provides gridded modelled daily hydrological time series forced by meteorological observations. It includes river discharge, soil moisture for three soil layers and snow water equivalenthttps://www.efas.eu/
GLOFASGlobal Flood Awareness System, operational within the Copernicus Emergency Management Service. It couples state-of-the art weather forecasts with a hydrological model and with its continental scale set-up, providing downstream countries with information on upstream river conditions as well as continental and global overviewshttps://www.globalfloods.eu/
EMODnet 
Physics
EMODnet Physics gathers, harmonises and makes available near real time river runoff and in-situ river runoff trends (monthly and annual means), accessible through the website with MapViewer controllershttps://emodnet.ec.europa.eu/geoviewer/

Table 4.6. River data providers.


Below are listed some other initiatives for handling freshwater inputs with focus on icebergs and R&D project:

  • Altiberg is a database for small icebergs (< 3km in length), detected by altimeters using the high-resolution waveforms (Tournadre et al., 2016), 🔗62;
  • BRONCO stands for “Benefits of dynamically modelled river discharge input for ocean and coupled atmosphere-land-ocean systems”: it is a Service Evolution Project run in the framework of Copernicus Marine Service to improve and standardise input of river discharge into global, regional and coastal models, 🔗63;
  • LAMBDA stands for Land-Marine Boundary Development & Analysis: it is another Service Evolution Project run in the framework of Copernicus Marine Service. It aims at improving the Copernicus Marine Service MFCs thermohaline circulation in coastal areas by better characterization of the land-marine boundary conditions, 🔗64.
 

4.2.7 OOFS fields as input for downscaling

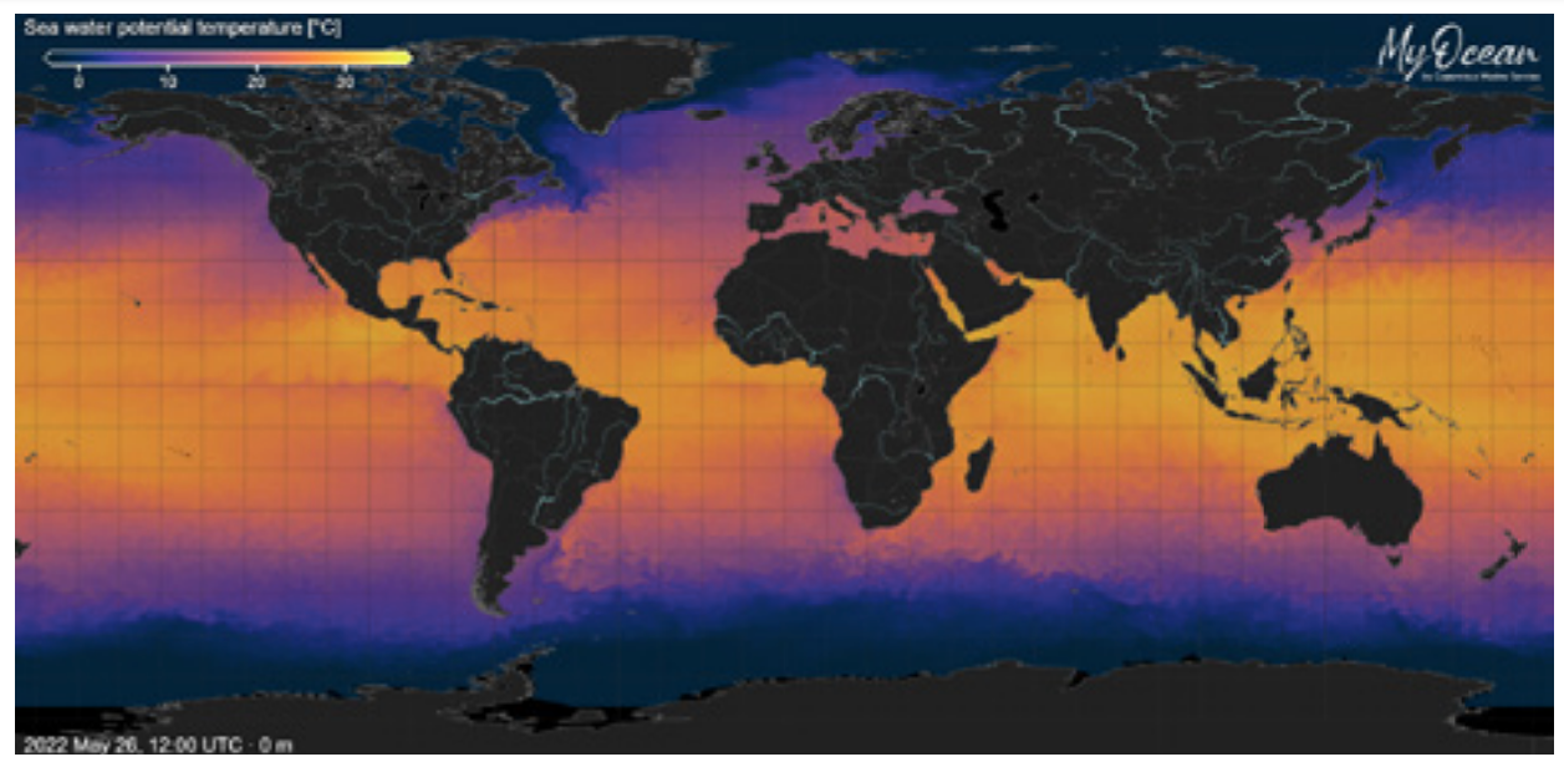
An OOFS may be set also using information from other OOFSs: this is the case of the so-called nesting models (for major details see Section 5.4.4). For example, the GLO-PHY - herein referred to as parent model - provides lateral open boundary conditions to the Mediterranean Sea Forecasting System (MedFS) - herein referred to as child model. Both systems are part of the Copernicus Marine Service catalogue. Figure 4.23 shows a typical ocean field at global scale from GLO-PHY - in this case, we display sea surface temperature forecast product. 

Figure 4.23. The GLO-PHY sea surface temperature on 26 May 2022 - source: https://marine.copernicus.eu/ through the Ocean Viewer: https://data.marine.copernicus.eu/viewer/expert


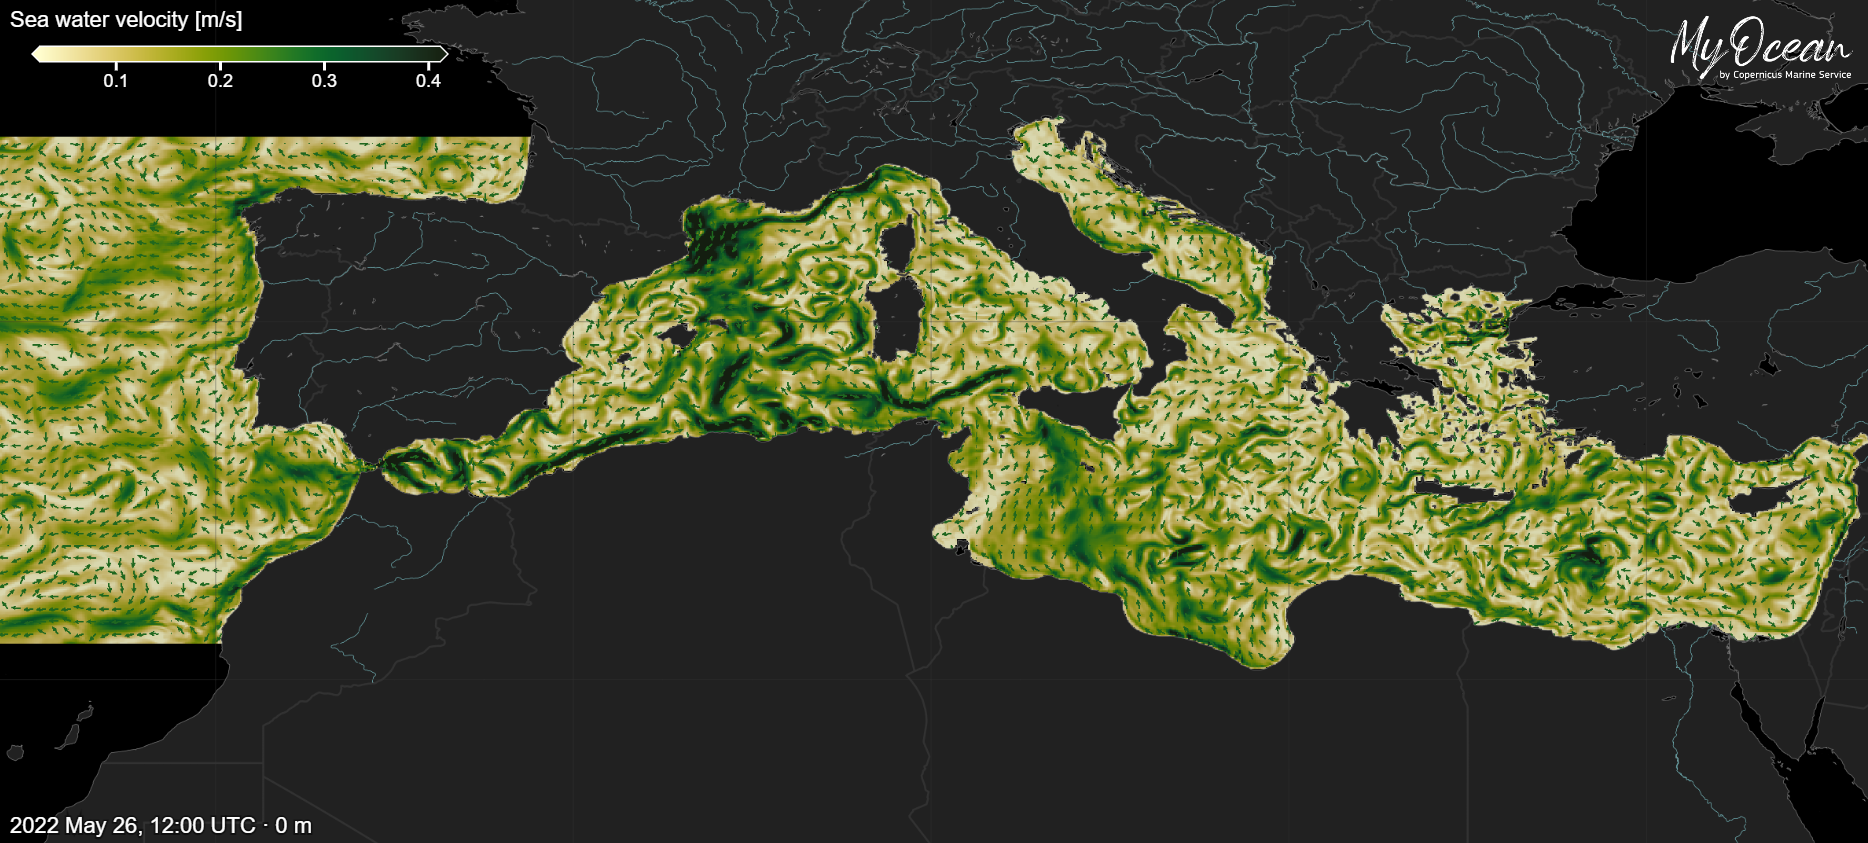
The parent model provides temperature, salinity, sea surface height, zonal and meridional velocity components to the Mediterranean Sea through 3 open boundaries located in the Atlantic Ocean. Ocean fields from the parent model are spatially and temporally interpolated over the open boundary sections and provided to the ocean circulation model of the child domain. Figure 4.24 shows as example the Mediterranean Sea surface currents forecast product after integrating the numerical model accounting for the GLO-PHY ocean fields as lateral open boundary conditions.

Figure 4.24. The MedFS sea surface currents on 26 May 2022 - source: https://marine.copernicus.eu/ through the Ocean Viewer https://data.marine.copernicus.eu/viewer/expert


For major details about the setup of both systems, please refer to the Copernicus Marine Service web pages dedicated to each product.

4.2.8 Climatology from observations

To describe the general oceanographic conditions at different time scales and spatial resolutions, climatological fields computed from observations can be used. They are defined as mean values of a certain variable in a certain period (e.g.month, season, etc.). They may be used for creating initial and/or boundary conditions for an ocean model, as well as validating numerical results and performing data assimilation. Since observations are irregularly distributed in space, an objective analysis (Chang et al. 2009) is needed in order to produce spatially gridded dataset that can be easily used by a numerical model. Numerical model results, being gridded, can be easily aggregated in time to produce a climatological field to be used as initial or boundary condition.

Climatologies may be also computed from NWP products to modify or to formulate ocean surface fluxes using mean momentum conditions from a reanalysis product (e.g., ECMWF ERA5, etc.) superposed with variability from the NWP fields. Additionally, observations such SSS and SST may be adopted for supplementing climatological data for surface flux relaxation to control model drifts. Finally, climatologies may be computed also from other ocean models to provide lateral open boundary conditions (numerics and methods will be presented in Chapter 5).

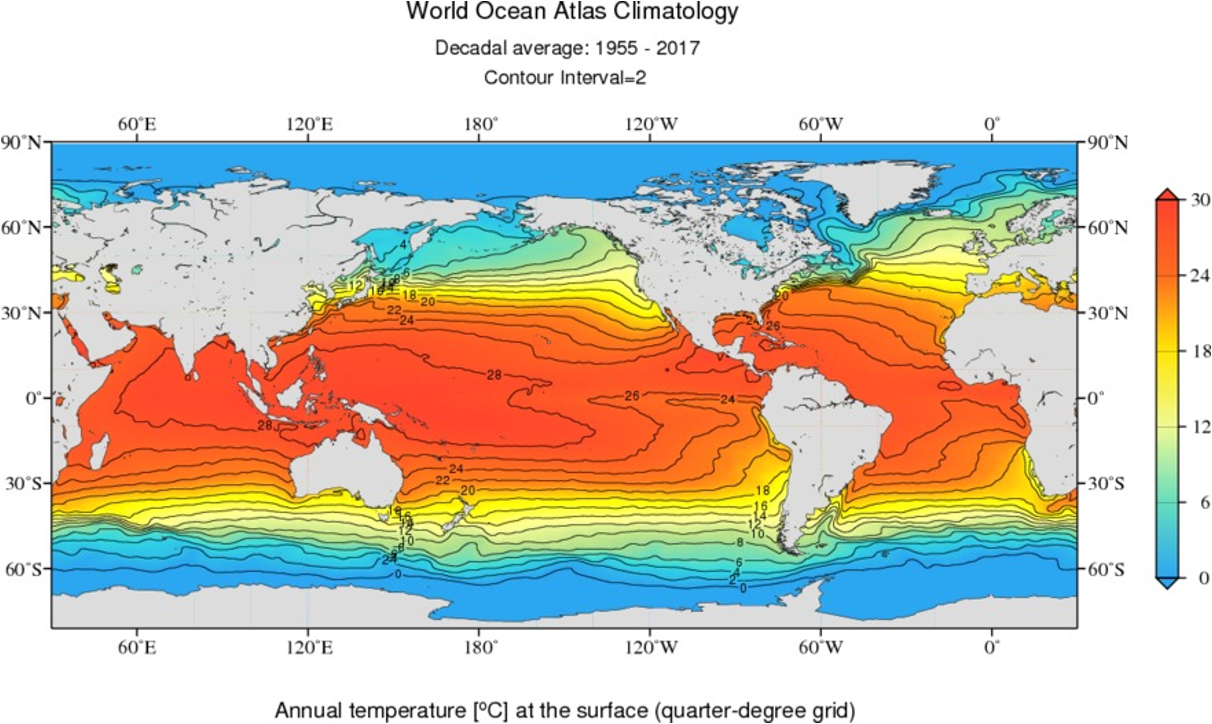
Figure 4.25 provides as an example of climatology the annual sea surface temperature computed over the period 1955-2017 for the global ocean by the WOA.

Figure 4.25. An example of climatology: temperature field from World Ocean Atlas Climatology - source : https://www.ncei.noaa.gov/

 Table 4.7 provides a list of international atlases.

DatasetDescriptionProvider
WOAWorld Ocean Atlas (Boyer et al., 2019) provides climatological temperature (°C), salinity (unitless), density (kg/m3), mixed layer depth (m), and other biogeochemical parameters (for the latter, major details are provided in Chapter 9)https://www.ncei.noaa.gov/products/world-ocean-atlas
WODWorld Ocean Database (Boyer et al., 2019), is a continuation of the Climatological Atlas of the World Ocean (Levitus, 1982) and at present represents one of the world’s largest collection of uniformly formatted, quality controlled, and publicly available ocean profiles datahttps://www.ncei.noaa.gov/products/world-ocean-database
SeaDataNetSeaDataNet is a distributed Marine Data Infrastructure for the management of large and diverse sets of data deriving from in situ of the seas and oceans. It provides an online access to data on regional climatologies products – gridded fields of sea temperature and salinity - for the European seas (Arctic Sea, Baltic Sea, Black Sea, Mediterranean Sea, North Sea, North Atlantic Ocean) and for the global oceanhttps://www.seadatanet.org/

Table 4.7. Climatology products and providers.


References

Barnier, B., Siefridt, L., and Marchesiello, P. (1995). Thermal forcing for a global ocean circulation model using a three-year climatology of ECMWF analyses. Journal of Marine Systems, 6(4), 363-380, https://doi.org/10.1016/0924-7963(94)00034-9

Barnier, B. (1998). Forcing the ocean. In “Ocean Modeling and Parameterization”, Editors: E. P. Chassignet and J. Verron, Eds., Kluwer Academic, 45-80. 

Bell, M.J., Lefèbvre, M., Le Traon, P.-Y., Smith, N., Wilmer-Becker, K. (2009). GODAE the global ocean data assimilation experiment. Oceanography, 22, 14-21, https://doi.org/10.5670/oceanog.2009.62

Bellingham, J. (2009). Platforms: Autonomous Underwater Vehicles. In “Encyclopedia of Ocean Sciences”, Editors-in-Chief: J. K. Cochran, H. Bokuniewicz, P. Yager, ISBN: 9780128130827, doi:10.1016/B978-012374473- 9.00730-X 

Bourlès, B., Lumpkin, R., McPhaden, M.J., Hernandez, F., Nobre, P., Campos, E., Yu, L. Planton, S., Busalacchi, A., Moura, A.D., Servain, J., and Trotte, Y. (2008). The PIRATA program: History, accomplishments, and future directions. Bulletin of the American Meteorological Society, 89, 1111-1125, https://doi.org/10.1175/2008BAMS2462.1

Boyer, T.P., Baranova, O.K., Coleman, C., Garcia, H.E., Grodsky, A., Locarnini, R.A., Mishonov, A.V., Paver, C.R., Reagan, J.R., Seidov, D., Smolyar, I.V., Weathers, K.W., Zweng, M.M. (2019). World Ocean Database 2018. A. V. Mishonov, Technical Editor, NOAA Atlas NESDIS 87.

Bouttier, F., and Courtier, P. (2002). Data assimilation concepts and methods. Meteorological training course lecture series, ECMWF, 59. Available at https://www.ecmwf.int/en/elibrary/16928-data-assimilation-concepts-and-methods

Capet, A., Fernández, V., She, J., Dabrowski, T., Umgiesser, G., Staneva, J., Mészáros, L., Campuzano, F., Ursella, L., Nolan, G., El Serafy, G. (2020), Operational Modeling Capacity in European Seas - An EuroGOOS Perspective and Recommendations for Improvement. Frontiers in Marine Science, 7:129, https://doi.org/10.3389/fmars.2020.00129

Carrassi, A., Bocquet, M., Bertino, L., Evensen, G. (2018). Data assimilation in the geosciences: An overview of methods, issues, and perspectives. Wiley Interdisciplinary Reviews: Climate Change, 9(5), e535, https://doi.org/10.1002/wcc.535

Chang, Y.-S., Rosati, A. J., Zhang, S., and Harrison, M. J. (2009). Objective Analysis of Monthly Temperature and Salinity for the World Ocean in the 21st century: Comparison with World Ocean Atlas and Application to Assimilation Validation. Journal of Geophysical Research: Oceans, 114(C2), https://doi.org/10.1029/2008JC004970

Crocker, R., Maksymczuk, J., Mittermaier, M., Tonani, M., and Pequignet, C. (2020). An approach to the verification of high-resolution ocean models using spatial methods. Ocean Science, 16, 831-845, https://doi.org/10.5194/os-16-831-2020

Crosnier, L., and Le Provost, C. (2007). Inter-comparing five forecast operational systems in the North Atlantic and Mediterranean basins: The MERSEA-strand1 Methodology. Journal of Marine Systems, 65(1-4), 354-375, https://doi.org/10.1016/j.jmarsys.2005.01.003

Cummings, J., Bertino, L., Brasseur, P., Fukumori, I., Kamachi, M., Martin, M.J., Mogensen, K., Oke, P., Testut, C.-E., Verron, J., Weaver, A. (2009). Ocean data assimilation systems for GODAE. Oceanography, 22, 96-109, https://doi.org/10.5670/oceanog.2009.69

Dai, A., and Trenberth, K. E. (2002). Estimates of freshwater discharge from continents: Latitudinal and seasonal variations. Journal of Hydrometeorology, 3(6), 660-687, https://doi.org/10.1175/1525-7541(2002)003<0660:EOFDFC>2.0.CO;2

Dai, A., Qian, T., Trenberth, K. E., Milliman, J. D. (2009). Changes in continental freshwater discharge from 1948-2004. Journal of Climate, 22(10), 2773-2791, https://doi.org/10.1175/2008JCLI2592.1

Dai, A. (2021). Hydroclimatic trends during 1950–2018 over global land. Climate Dynamics, 4027-4049, https://doi.org/10.1007/s00382-021-05684-1

De Mey, P. (1997). Data assimilation at the oceanic mesoscale: A review. Journal of Meteorological of Japan, 75(1b), 415-427, https://doi.org/10.2151/jmsj1965.75.1B_415

Carrassi, A., Bocquet, M., Bertino, L., Evensen, G. (2018). Data assimilation in the geosciences: An overview of methods, issues, and perspectives. Wiley Interdisciplinary Reviews: Climate Change, 9(5), e535, https://doi.org/10.1002/wcc.535

Donlon, C, Minnett, P., Gentemann, C., Nightingale, T.J., Barton, I., Ward, B., Murray, M. (2002). Toward improved validation of satellite sea surface skin temperature measurements for climate research. Journal of Climate, 15:353-369, https://doi.org/10.1175/1520-0442(2002)015<0353:TIVOSS>2.0.CO;2

Donlon, C., Casey, K., Robinson, I., Gentemann, C., Reynolds, R, Barton, I., Arino, O., Stark, J., Rayner, N., Le Borgne, P., Poulter, D., Vazquez-Cuervo, J., Armstrong, E., Beggs, H., Llewellyn-Jones, D., Minnett, P., Merchant, C., Evans, R. (2009). The GODAE High-Resolution Sea Surface Temperature Pilot Project. Oceanography, 22, 34-45, https://doi.org/10.5670/oceanog.2009.64

Drévillon, M., Greiner, E., Paradis, D., et al. (2013). A strategy for producing refined currents in the Equatorial Atlantic in the context of the search of the AF447 wreckage. Ocean Dynamics, 63, 63-82, https://doi.org/10.1007/s10236-012-0580-2

Eastwood, S., Le Borgne, P., Péré, S., Poulter, D. (2011). Diurnal variability in sea surface temperature in the Arctic. Remote Sensing of Environment, 115(10), 2594-2602, https://doi.org/10.1016/j.rse.2011.05.015

GHRSST Science Team (2012). The Recommended GHRSST Data Specification (GDS) 2.0, document revision 5, available from the GHRSST International Project Office, available at https://www.ghrsst.org/governance-documents/ghrsst-data-processing-specification-2-0-revision-5/

Griffies, S. M. (2006). Some ocean model fundamentals. In “Ocean Weather Forecasting”, Editoris: E. P. Chassignet and J. Verron, 19-73, Springer-Verlag, Dordrecht, The Netherlands, https://doi.org/10.1007/1-4020-4028-8_2 

Groom, S., Sathyendranath, S., Ban, Y,. Bernard, S., Brewin, R., Brotas, V., Brockmann, C., Chauhan, P., Choi, J-K., Chuprin, A., Ciavatta, S., Cipollini, P. Donlon, C., Franz, B., He, X., Hirata, T., Jackson, T., Kampel, M., Krasemann, H., Lavender, S., Pardo-Martinez, S., Mélin, F., Platt, T., Santoleri, R., Skakala, J., Schaeffer, B., Smith, M., Steinmetz, F., Valente, A., Wang, M. (2019). Satellite Ocean Colour: Current Status and Future Perspective. Frontiers in Marine Science, 6:485, https://doi.org/10.3389/fmars.2019.00485

Hamlington, B.D., Thompson, P.,. Hammond, W.C., Blewitt, G., Ray, R.D. (2016). Assessing the impact of vertical land motion on twentieth century global mean sea level estimates. Journal of Geophysical Research, 121(7), 4980-4993, https://doi.org/10.1002/2016JC011747

Hernandez, F., Bertino, L., Brassington, G.B., Chassignet, E., Cummings, J., Davidson, F., Drevillon, M., Garric, G., Kamachi, M., Lellouche, J.-M., et al. (2009). Validation and intercomparison studies within GODAE. Oceanography, 22(3), 128-143, https://doi.org/10.5670/oceanog.2009.71

Hernandez, F., Blockley, E., Brassington, G B., Davidson, F., Divakaran, P., Drévillon, M., Ishizaki, S., Garcia-Sotillo, M., Hogan, P. J., Lagemaa, P., Levier, B., Martin, M., Mehra, A., Mooers, C., Ferry, N., Ryan, A., Regnier, C., Sellar, A., Smith, G. C., Sofianos, S., Spindler, T., Volpe, G., Wilkin, J., Zaron, E D., Zhang, A. (2015). Recent progress in performance evaluations and near real-time assessment of operational ocean products. Journal of Operational Oceanography, 8(sup2), https://doi.org/10.1080/1755876X.2015.1050282

Hernandez, F., Smith, G., Baetens, K., Cossarini, G., Garcia-Hermosa, I., Drevillon, M., ... and von Schuckman, K. (2018). Measuring performances, skill and accuracy in operational oceanography: New challenges and approaches. In “New Frontiers in Operational Oceanography”, Editors: E. Chassignet, A. Pascual, J. Tintoré, and J. Verron, GODAE OceanView, 759-796, https://doi.org/10.17125/gov2018.ch29 

Hollingsworth, A., Shaw, D. B., Lönnberg, P., Illari, L., Arpe, K., and Simmons, A. J. (1986). Monitoring of Observation and Analysis Quality by a Data Assimilation System. Monthly Weather Review, 114(5), 861-879, https://doi.org/10.1175/1520-0493(1986)114<0861:MOOAAQ>2.0.CO;2

International Altimetry Team (2021). Altimetry for the future: building on 25 years of progress. Advances in Space Research, 68(2), 319-363, https://doi.org/10.1016/j.asr.2021.01.022

Kurihara, Y., Murakami, H., and Kachi, M. (2016). Sea surface temperature from the new Japanese geostationary meteorological Himawari-8 satellite. Geophysical Research Letters, 43(3), 1234-1240, https://doi.org/10.1002/2015GL067159

Josey, S.A., Kent, E.C., Taylor, P.K. (1999). New insights into the ocean heat budget closure problem from analysis of the SOC air-sea flux climatology. Journal of Climate, 12(9), 2856-2880, https://doi.org/10.1175/1520-0442(1999)012<2856:NIITOH>2.0.CO;2

Jolliffe, I.T., and Stephenson, D.B. (2003). Forecast Verification: A Practitioner’s Guide in Atmospheric Sciences, John Wiley & Sons Ltd., Hoboken, 296 pages, ISBN: 978-0-470-66071-3

Legates, D.R., McCabe, G.J. Jr. (1999). Evaluating the use of “Goodness of Fit” measures in hydrologic and hydroclimatic model validation. Water Resources Research, 35, 233-241, https://doi.org/10.1029/1998WR900018

Legates, D., and Mccabe, G. (2013). A refined index of model performance: A rejoinder. International Journal of Climatology, 33(4), 1053-1056, https://doi.org/10.1002/joc.3487

Le Traon, P.Y., Larnicol, G., Guinehut, S., Pouliquen, S., Bentamy, A., Roemmich, D., Donlon, C., Roquet, H., Jacobs, G., Griffin, D., Bonjean, F., Hoepffner, N., Breivik, L.A. (2009). Data assembly and processing for operational oceanography 10 years of achievements. Oceanography, 22(3), 56-69, https://doi.org/10.5670/oceanog.2009.66

Levitus, S. (1982). Climatological Atlas of the World Ocean. NOAA/ERL GFDL Professional Paper 13, Princeton, N.J., 173 pp. (NTIS PB83-184093). Lindstrom, E., Gunn, J., Fischer, A., McCurdy, A. and Glover L.K. (2012). A Framework for Ocean Observing. IOC Information Document;1284, Rev. 2, https://doi.org/10.5270/OceanObs09-FOO 

Maksymczuk J., Hernandez, F., Sellar, A., Baetens, K., Drevillon, M., Mahdon, R., Levier, B., Regnier, C., Ryan, A. (2016). Product Quality Achievements Within MyOcean. Mercator Ocean Journal #54. Available at https://www.mercator-ocean.eu/en/ocean-science/scientific-publications/mercator-ocean-journal/newsletter-54-focusing-on-the-main-outcomes-of-the-myocean2-and-follon-on-projects/

Mantovani C., Corgnati, L., Horstmann, J. Rubio, A., Reyes, E., Quentin, C., Cosoli, S., Asensio, J. L., Mader, J., Griffa, A. (2020). Best Practices on High Frequency Radar Deployment and Operation for Ocean Current Measurement. Frontiers in Marine Science, 7:210, https://doi.org/10.3389/fmars.2020.00210

Marks, K., and Smith, W. (2006). An Evaluation of Publicly Available Global Bathymetry Grids. Marine Geophysical Researches, 27, 19-34, https://doi.org/10.1007/s11001-005-2095-4

Martin, M.J. (2016). Suitability of satellite sea surface salinity data for use in assessing and correcting ocean forecasts. Remote Sensing of Environment, 180, 305-319. https://doi.org/10.1016/j.rse.2016.02.004

Martin, M.J, King, R.R., While, J., Aguiar, A.B. (2019). Assimilating satellite sea-surface salinity data for SMOS Aquarius and SMAP into a global ocean forecasting system. Quarterly Journal of the Royal Meteorological Society, 145(719), 705-726, https://doi.org/10.1002/qj.3461

McPhaden, M. J., Busalacchi, A.J., Cheney, R., Donguy, J.R., Gage, K.S., Halpern, D., Ji, M., Julian, P., Meyers, G., Mitchum, G.T., Niller, P.P., Picaut, J., Reynolds, R.W., Smith, N., Takeuchi, K. (1998). The Tropical Ocean-Global Atmosphere (TOGA) observing system: A decade of progress. Journal of Geophysical Research, 103, 14169-14240, https://doi.org/10.1029/97JC02906

McPhaden, M. J., Meyers, G., Ando, K., Masumoto, Y., Murty, V. S., Ravichandran, M., Syamsudin, F., Vialard, J., Yu, L., and Yu, W. (2009). RAMA: The Research Moored Array for African-Asia-Australian Monsoon Analysis and Prediction. Bulletin of the American Meteorological Society, 90, 459-480, https://doi.org/10.1175/2008BAMS2608.1

Moore, A.M., Martin, M.J., Akella, S., Arango, H.G., Balmaseda, M., Bertino, L., Ciavatta, S., Cornuelle, B., Cummings, J., Frolov, S., Lermusiaux, P., Oddo, P., Oke, P.R., Storto, A., Teruzzi, A., Vidard, A., Weaver, A.T. (2019). Synthesis of Ocean Observations Using Data Assimilation for Operational, Real-Time and Reanalysis Systems: A More Complete Picture of the State of the Ocean. Frontiers in Marine Science, 6:90, https://doi.org/10.3389/fmars.2019.00090

Naeije, M., Schrama, E., and Scharroo, R. (2000). The Radar Altimeter Database System project RADS. Published in “IGARSS 2000. IEEE 2000 International Geoscience and Remote Sensing Symposium. Taking the Pulse of the Planet: The Role of Remote Sensing in Managing the Environment”, doi:10.1109/ IGARSS.2000.861605

Nurmi P. (2003). Recommendations on the verification of local weather forecasts (at ECMWF member states). Consultancy report to ECMWF Operations Department. Available at https://www.cawcr.gov.au/projects/verification/Rec_FIN_Oct.pdf

O’Carroll, A.G., Armstrong, E.M., Beggs, H., Bouali, M., Casey, K.S., Corlett, G.K., Dash, P., Donlon, C.J., Gentemann, C.L., Hoyer, J.L., Ignatov, A., Kabobah, K., Kachi, M. Kurihara, Y., Karagali, I., Maturi, E., Merchant, C.J., Minnett, P., Pennybacker, M., Ramakrishnan, B., Ramsankaran, R., Santoleri, R., Sunder, S., Saux Picart, S., Vazquez-Cuervo, J., Wimmer, W. (2019). Observational needs of sea surface temperature, Frontiers in Marine Science, 6:420, https://doi.org/10.3389/fmars.2019.00420

Peng, G., Downs, R.R., Lacagnina, C., Ramapriyan, H., Ivánová, I., Moroni, D., Wei, Y., Larnicol, G., Wyborn, L., Goldberg, M., Schulz, J., Bastrakova, I., Ganske, A., Bastin, L., Khalsa, S.J.S., Wu, M., Shie, C.-L., Ritchey, N., Jones, D., Habermann, T., Lief, C., Maggio, I., Albani, M., Stall, S., Zhou, L., Drévillon, M., Champion, S., Hou, C.S., Doblas-Reyes, F., Lehnert, K., Robinson, E. and Bugbee, K., (2021). Call to Action for Global Access to and Harmonization of Quality Information of Individual Earth Science Datasets. Data Science Journal, 20(1), 19, http://doi.org/10.5334/dsj-2021-019

Petrenko, B., Ignatov, A., Kihai, Y., Dash, P. (2016). Sensor-Specific Error Statistics for SST in the Advanced Clear-Sky Processor for Oceans. Journal of Atmospheric and Oceanic Technology, 33(2), 345-359, https://doi.org/10.1175/JTECH-D-15-0166.1

Roarty, H., Cook, T., Hazard, L., George, D., Harlan, J., Cosoli, S., Wyatt, L., Alvarez Fanjul, E., Terrill, E., Otero, M., Largier, J., Glenn, S., Ebuchi, N., Whitehouse, Br., Bartlett, K., Mader, J., Rubio, A., Corgnati, L., Mantovani, C., Griffa, A., Reyes, E., Lorente, P., Flores-Vidal, X., Saavedra-Matta, K. J., Rogowski, P., Prukpitikul, S., Lee, S-H., Lai, J-W., Guerin, C-A., Sanchez, J., Hansen, B., Grilli, S. (2019). The Global High Frequency Radar Network. Frontiers in Marine Science, 6:164, https://doi.org/10.3389/fmars.2019.00164

Ryan, A. G., Regnier, C., Divakaran, P., Spindler, T., Mehra, A., Smith, G. C., et al. (2015). GODAE OceanView Class 4 forecast verification framework: global ocean inter-comparison. Journal of Operational Oceanography, 8(sup1), S112-S126, https://doi.org/10.1080/1755876X.2015.1022330

Scharroo, R. (2012). RADS version 3.1: User Manual and Format Specification. Available at http://rads.tudelft.nl/rads/radsmanual.pdf

Sotillo, M. G., Garcia-Hermosa, I., Drévillon, M., Régnier, C., Szczypta, C., Hernandez, F., Melet, A., Le Traon, P.Y. (2021). Communicating CMEMS Product Quality: evolution & achievements along Copernicus-1 (2015- 2021). Mercator Ocean Journal #57. Available at https://marine.copernicus.eu/news/copernicus-1-marine-service-achievements-2015-2021 

Tonani, M., Balmaseda, M., Bertino, L., Blockley, E., Brassington, G., Davidson, F., Drillet, Y., Hogan, P., Kuragano, T., Lee, T., Mehra, A., Paranathara, F., Tanajura, C., Wang, H. (2015). Status and future of global and regional ocean prediction systems. Journal of Operational Oceanography, 8, s201-s220, https://doi.org/10.1080/1755876X.2015.1049892

Tournadre, J., Bouhier, N., Girard-Ardhuin, F., Remy, F. (2015). Large icebergs characteristics from altimeter waveforms analysis. Journal of Geophysical Research: Oceans, 120(3), 1954-1974, https://doi.org/10.1002/2014JC010502

Tozer, B., Sandwell, D.T., Smith, W.H.F., Olson, C., Beale, J. R., and Wessel, P. (2019). Global bathymetry and topography at 15 arc sec: SRTM15+. Earth and Space Science, 6, 1847-1864, https://doi.org/10.1029/2019EA000658

Vinogradova, N.T., Ponte, R.M., Fukumori, I., and Wang, O. (2014). Estimating satellite salinity errors for assimilation of Aquarius and SMOS data into climate models. Journal of Geophysical Research: Oceans, 119(8), 4732-4744, https://doi.org/10.1002/2014JC009906

Vinogradova N., Lee, T., Boutin, J., Drushka, K., Fournier, S., Sabia, R., Stammer, D., Bayler, E., Reul, N., Gordon, A., Melnichenko, O., Li, L., Hackert, E., Martin, M., Kolodziejczyk, N., Hasson, A., Brown, S., Misra, S., and Linkstrom, E. (2019). Satellite Salinity Observing System: Recent Discoveries and the Way Forward. Frontiers in Marine Science, 6:243, https://doi.org/10.3389/fmars.2019.00243

Zhang H., Beggs, H., Wang, X.H., Kiss, A. E., Griffin, C. (2016). Seasonal patterns of SST diurnal variation over the Tropical Warm Pool region. Journal of Geophysical Research: Oceans, 121(11), 8077-8094, https://doi.org/10.1002/2016JC012210

Chapter 4

Architecture of ocean monitoring and forecasting systems

To start contributing, sharing knowledge and editing the WIKI, please login