
CHAPTER
COORDINATORS
COORDINATORS
Giovani Coppini
11.2
Examples of advanced downstream systems

11.2.1
Sea Situational Awareness (web pages and other dissemination mechanisms)
Dissemination services provide users with databases on relevant environmental information and set up their formatting to support marine and maritime activities. These services include the collection and validation of existing information and the production of new geo-localised information to users. Mechanisms for data sharing among databases are offered to intermediate and final users, so that the integration with existing services is facilitated.
The mechanisms of access to databases from private and public users is a matter of concern for the dissemination services as it could limit the accessibility of the services. Users should be able to access information in the applications through the Internet, using either desktop or mobile phone.
These issues are quite critical since information on marine and coastal areas is currently dispersed in heterogeneous, not connected, poorly known and not accessible systems. Consequently, it is important to develop systems that widen availability, improve information sharing, and facilitate access to the data. Public and private users are supported by mechanisms of open and free access, including massive (e.g. FTP, THREDDS, P2P) and system communication services (e.g. web services, tiling services).
11.2.1.1
The Copernicus Marine Service MyOcean Viewer
The Copernicus Marine Service MyOcean Viewer (🔗5) allows exploration of most of the online catalogue with multi-projection maps, graphs vs. time, and elevation and/or distance. Using information from both satellite and in-situ observations, the CMEMS provides state-of-the-art analyses and forecasts daily, which offer the capability to observe, understand, and predict the marine environment state (Figure 11.1). The Copernicus Marine Service MyOcean Viewer has been developed by Lobelia Earth. The Basemap layer contains information from the GSHHG dataset provided by the University of Hawaii and the US NOAA.
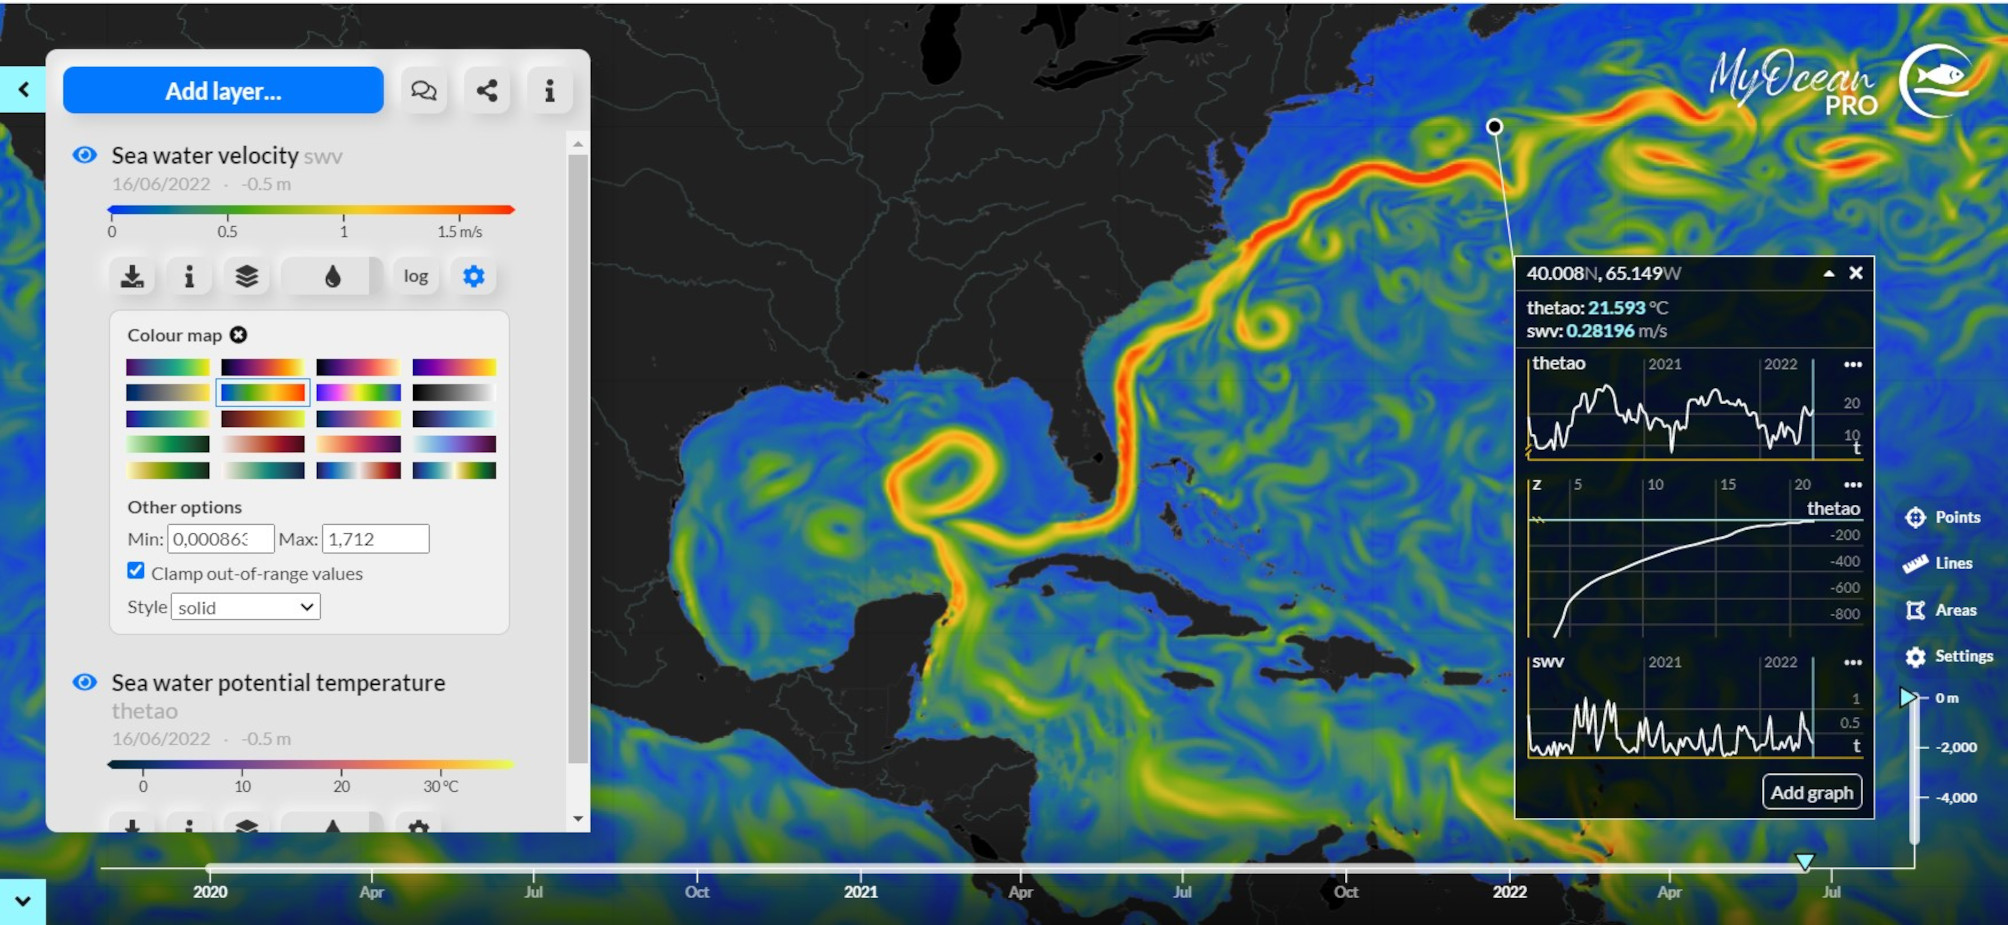
Figure 11.1. Examples of screenshots from MyOcean Viewer web application, including visualisation of seawater velocity for the Global Ocean and time series/time-depth plots in a specific location - source: https://data.marine.copernicus.eu/products
11.2.1.2
SeaConditions
An example of web service for sea situational awareness is SeaConditions (🔗6). It is a service providing weather forecasts, including oceanographic and sea state forecasts (sea surface temperature, surface currents, significant wave height and direction, wave period, sea level), meteorological forecasts (air temperature, mean sea level pressure, precipitation, cloud cover, and 10 metre winds), bathymetry and satellite observations of chlorophyll-a, and water transparency. Forecasts are referred to a time period of 5 days and are based on state-of- the-art meteorological, oceanographic, and wave modelling that allow obtaining high quality data (Figure 11.2). SeaConditions includes data from Copernicus Marine Service (including satellite data) and the ECMWF.
SeaConditions covers the Mediterranean Sea: it has commercial and free versions available on the web and downloadable for mobile (Google Play and Apple Store). Its users are more than 100000.
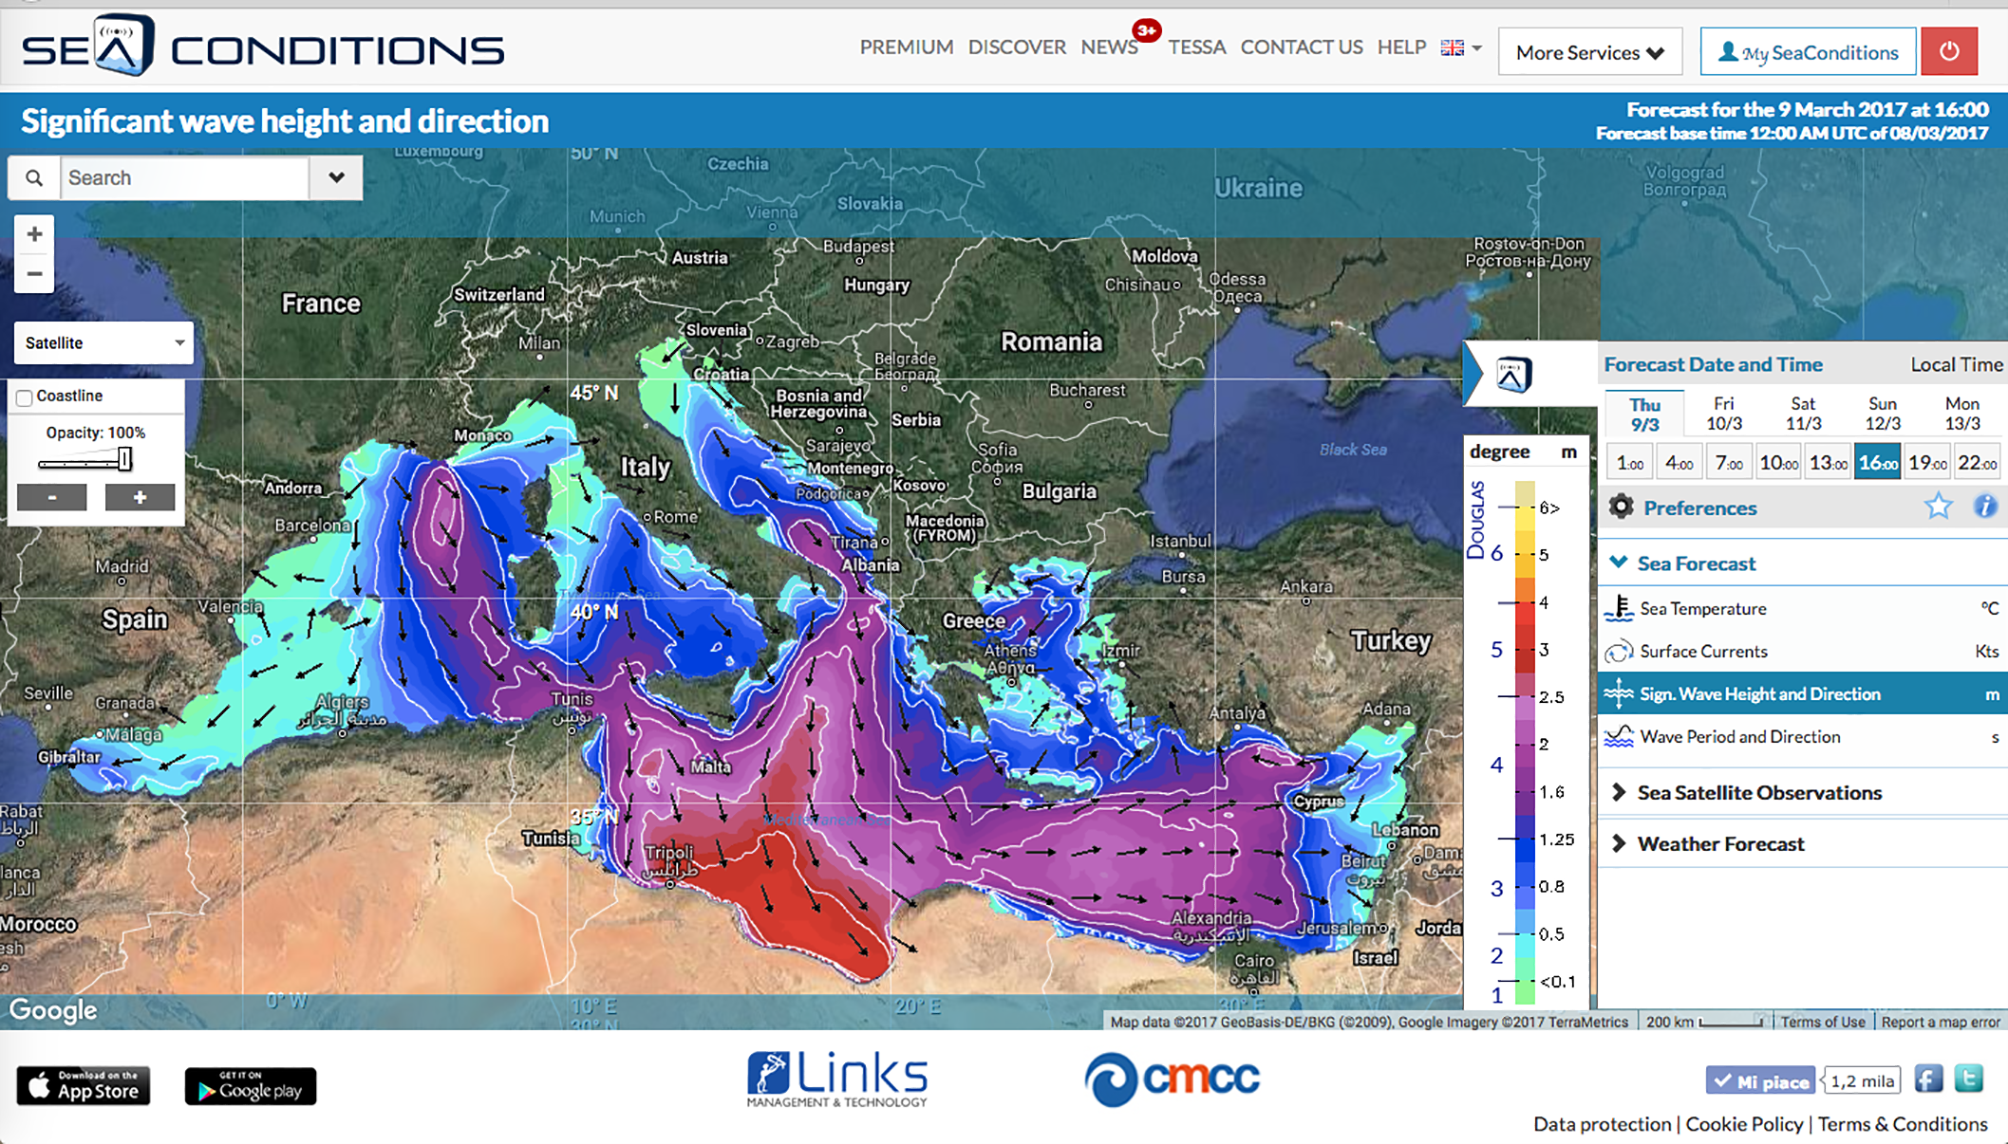
Figure 11.2. SeaConditions web service for the Mediterranean Sea.
11.2.1.3
Marine-Analyst
The Marine-Analyst (🔗7 ) is a platform for searching, viewing, processing, transferring, advertising, and disseminating marine spatial data from numerous data sources (Figure 11.3).
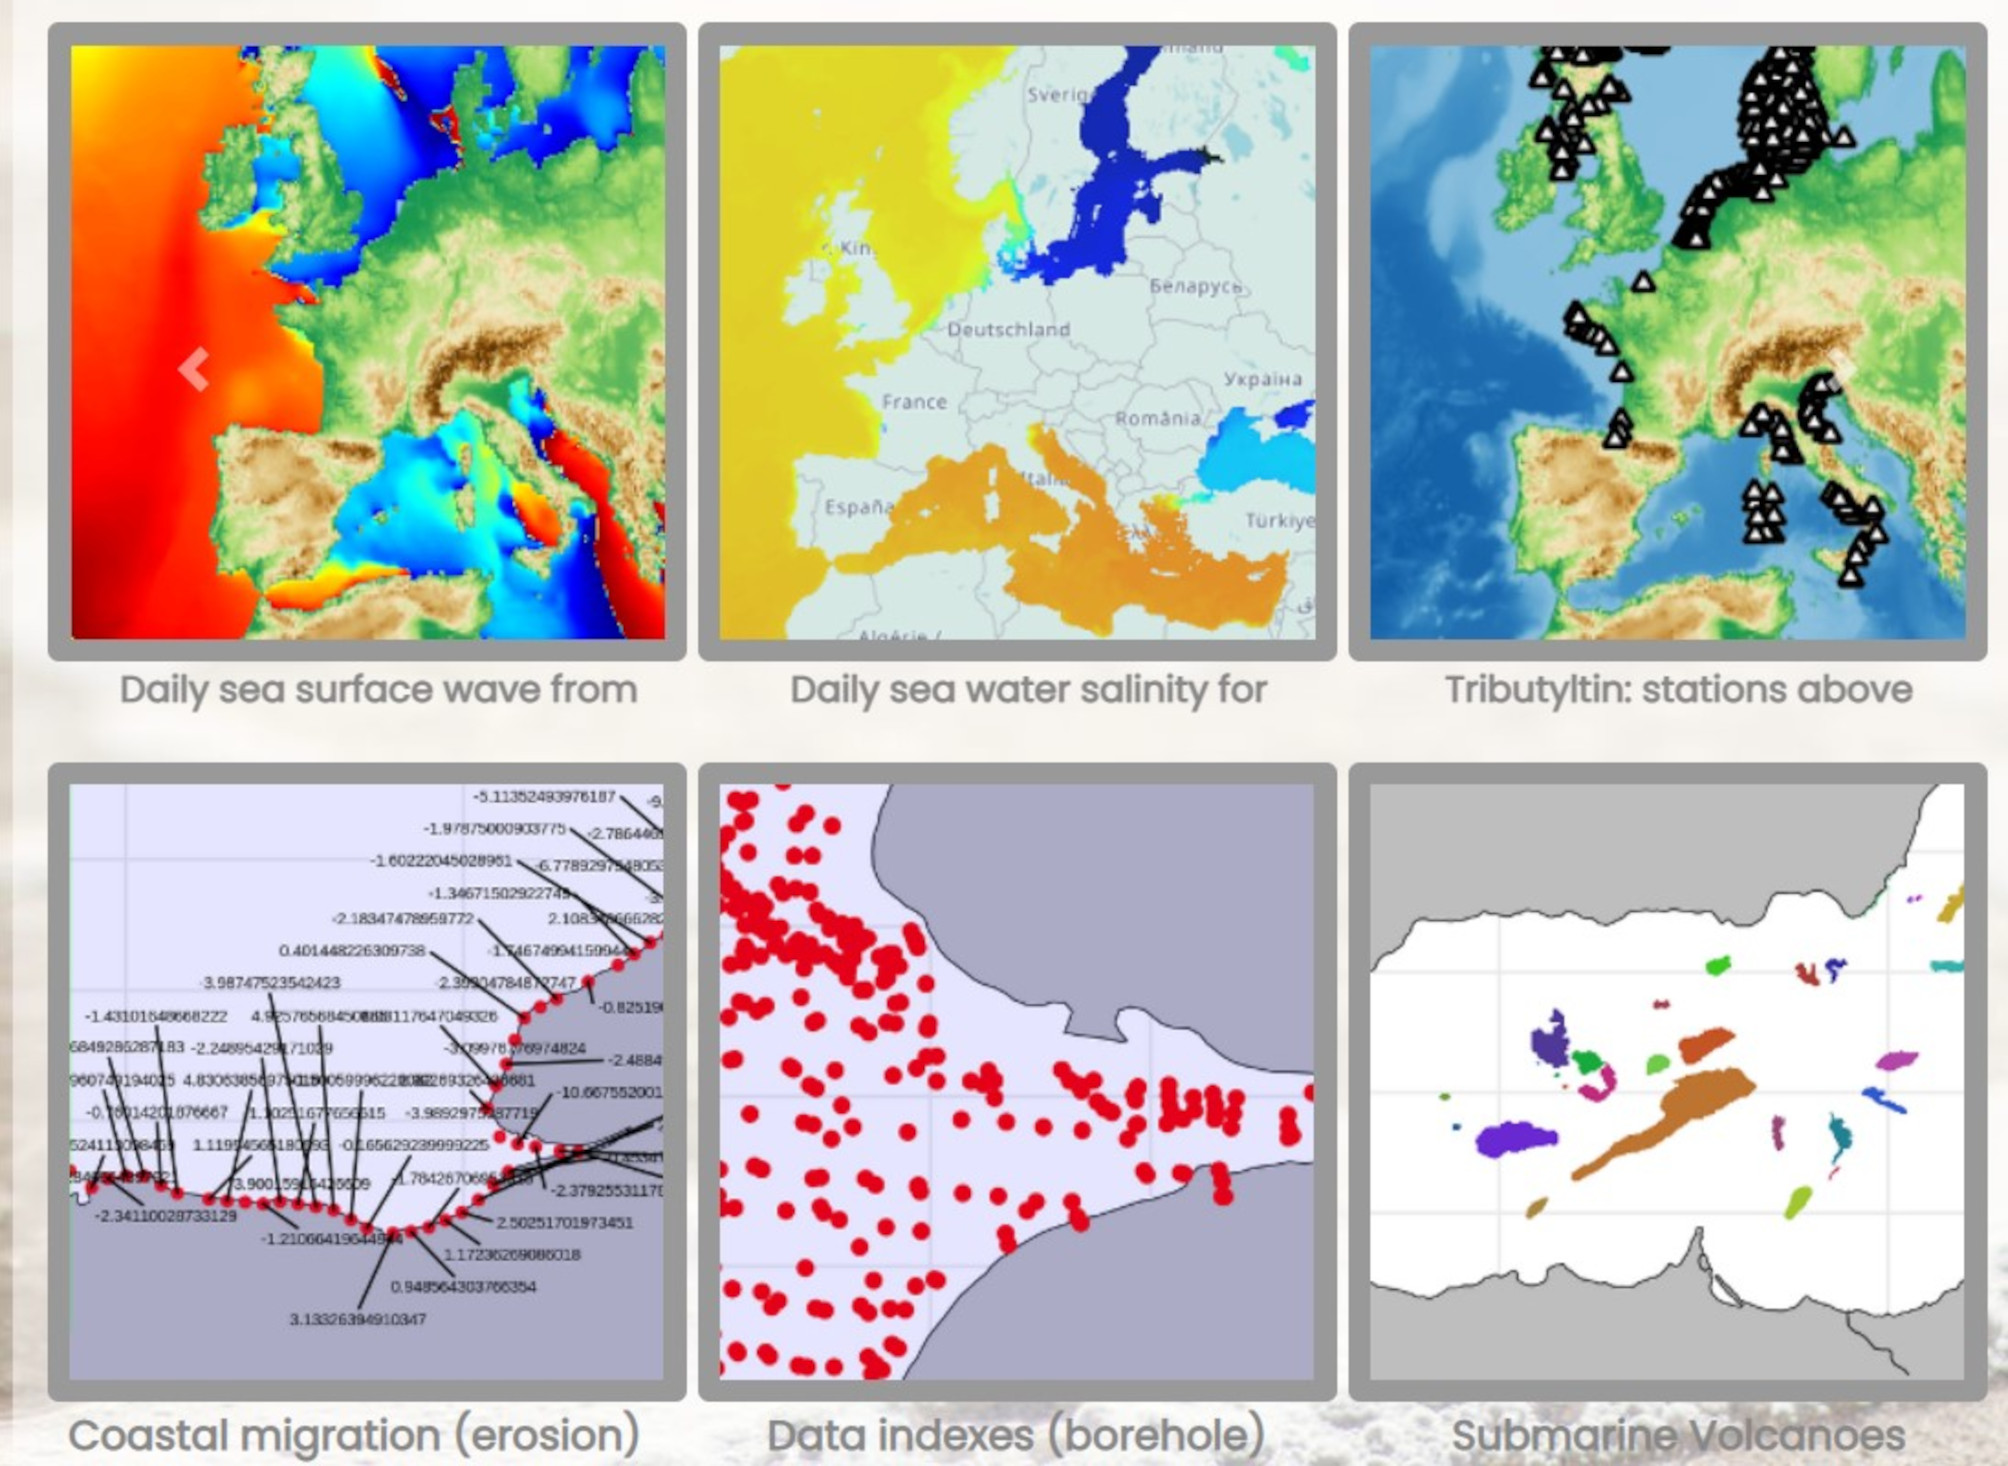
Figure 11.3. Example of data accessible from Marine-Analyst.eu application.
Launched in October 2020, it is powered by WEkEO (🔗8), the Copernicus DIAS. The Marine-Analyst.eu enables users to access data and key analyses for the location of their choice in Europe. It offers a personal dashboard where each user can collate the reports created for the chosen datasets. Generating on-demand data analyses for any location, the platform is able to address multidisciplinary challenges, for example:
- Maritime spatial planning: it represents a solution for coordinating decision-making on identified areas and specific activities, by considering a basin as a whole or partitioning it, including its ecological functioning and the activities it supports, e.g. zonation based on essential biophysical ocean parameters (such as chlorophyll Chla and light attenuation Kd) (from Copernicus Marine Service), human activities inventory (from EMODnet), etc. (“MSP challenge” at the Ocean Hackathon Brest 2020);
- Climate change: addressing climate change not only requires better science, but it is also crucial to inform journalists, interested citizens, and the wider public. The Marine-Analyst facilitates access to information and transparent analyses, e.g. sea surface temperature trends and anomalies (from Copernicus Marine Copernicus), coastal erosion (from EMODnet) (“Climate change at my Beach challenge” at the Hack the Ocean Hackathon 2019).
- Marine protected areas: park managers benefit from simplified access to various information comprising key information for the management of their MPA, e.g. MPA bulletins (from Copernicus Marine Service, forecast products), vessel density hierarchical clustering and statistical analysis (from EMODnet) (Environmental impact of Shipping traffic at the Blue Innovation Hackathon 2021).
11.2.1.4
NOAA Sea Level Rise viewer
NOAA provides map viewer and applications for marine data such as the Sea Level Rise - Map Viewer (🔗9), which gives users a way to visualise community-level impacts from coastal flooding or sea level rise (up to 10 feet above average high tides). Photo simulations of how future flooding might impact local landmarks are also provided, as well as data related to water depth, connectivity, flood frequency, socio-economic vulnerability, wetland loss and migration, and mapping confidence. The viewer shows areas along the contiguous United States coast, except for the Great Lakes. The maps are produced using detailed elevation maps with local and regional tidal variability. By using real photos at some specific locations, the viewer is able to show the impact of a certain sea level rise in the “real world” (Figure 11.4)
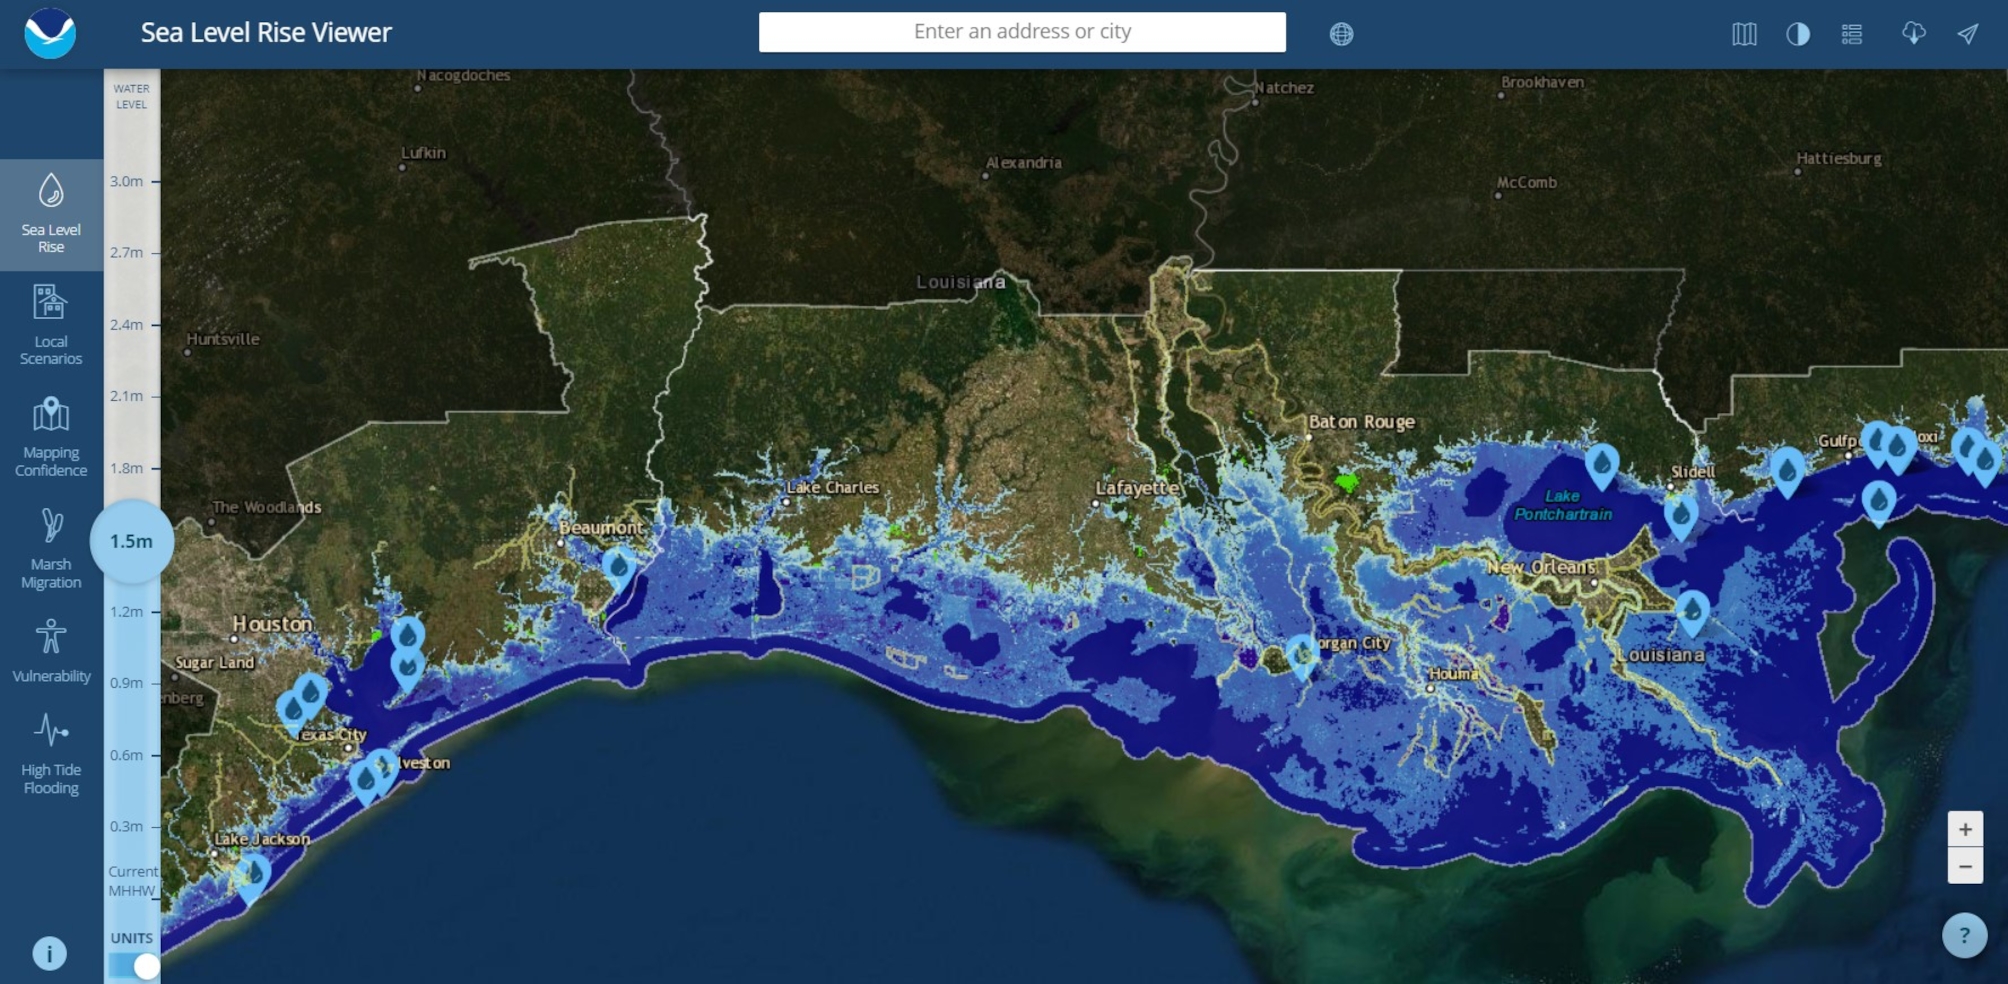
Figure 11.4. Example of NOAA Viewer.
11.2.2
Oil spill forecasting
In the past decade, much effort has been made to support operational oil spill modelling as a crucial component of the response. The most advanced systems are fully operational 24/7, meet the robustness and accuracy criteria, as well as the real-time requirements in terms of performance and dynamic service delivery. Examples of these systems are: OSCAR (Aamo et al., 1997), GNOME (Zelenke et al., 2012), OilMap (Spaulding et al., 1992), MOTHY (Daniel, 1996), MEDSLIK-II (De Dominicis et al., 2013), COSMoS (Marcotte et al., 2016), and OpenDrift (Dagestad et al., 2018). Oil spill models’ capabilities range from prediction of sea surface and upper layer transport to fully 3D oil and associated gas movement, including intrusion formation and high-pressure physics effects.
Incorporated oil spill models are coupled to up-to-date meteo-ocean monitoring and forecasting systems that provide the fields of ocean circulation, wind, and waves on a regular basis. The Copernicus Marine Service provides such data to most European systems. This information not only allows computing the oil drift, but it also helps to simulate the oil transformation processes and interaction with sediments, both coastal and seabed. The results are typically represented by oil mass balance time series delineating what fraction of the original spilled oil is expected to be kept afloat, evaporated, dispersed in the water column, beached or sedimented.
During the oil spill accidents, tight coordination between the oil spill detection/monitoring unit and operational modelling is vital for starting the spill forecasts, ground-truthing, and fast decision making. Real oil spills provided unique opportunities to examine the predictive skills of operational oil spill models, using observations carried out during oil spill accidents. Such combined studies have been conducted on spills in many geographic regions: the Prestige disaster in the Atlantic Spanish coast in 2002 (Castanedo et al., 2006; Daniel, 2010), the Fu Shan Hai wreck in the Baltic Sea in 2003 (De Carolis et al., 2013), the Lebanon crisis in 2006 (Coppini et al., 2011), the Kerch Strait oil spill in 2007 (Ivanov, 2010), the Deepwater Horizon oil spill in the Gulf of Mexico in 2010 (Liu et al., 2013), the Agia Zoni II oil spill in the Aegean Sea in 2017 (Coppini et al., 2018), the Sanchi spill disaster in the East China Sea in 2018 (Qiao et al., 2019), the Ulysse-Virginia oil spill in the Ligurian Sea in 2018 (Liubartseva et al., 2020a; Daniel et al., 2021), and in the Grande America accident in the Bay of Biscay in 2019 (Daniel et al., 2020).
Since oil transport is mainly controlled by ocean currents, the accuracy of oil spill simulations crucially depends on the resolution of the hydrodynamic models used. To resolve coastal scale processes, downscaling techniques that switch from high-resolution hydrodynamics to ultra-fine scales, with a resolution of around 100 m, are being developed. As an example, an operational decision supporting system for oil spill emergencies addressed to the Italian Coast Guard was developed by Sorgente et al. (2020) in the Western and Central Mediterranean Sea. Progress in downscaling led to operational oil spill modelling in harbour and port areas, such as the Port of Taranto in south Italy (Liubartseva et al., 2020b) and the Port of Tarragona in Spain (Morell Villalonga et al., 2020). In these three examples, the MEDSLIK-II oil spill model was applied in various configurations. Two examples of oil spill forecasting applications are described in the following subsections.
11.2.2.1
MOTHY
MOTHY is a dual system consisting of an ocean model, developed to best represent the surface current, and a slick or object model (Figure 11.5). It operates worldwide, and can be implemented immediately, 24 hours a day, by the marine forecasting service of the National Forecasting Centre of Météo-France (🔗10), located in Toulouse. This Centre provides met-ocean support and drift forecasts to assist authorities in charge of accidental marine pollution and search and rescue operations. The oil spill forecasting system was developed by combining the Cedre's (🔗11) expertise in oil chemistry with the Météo-France's expertise in weather and ocean forecasting and modelling to provide a robust operational service maintained by Météo-France. The system is operated at Cedre's request in support of oil spill response operations and at the request of the Maritime Rescue Coordination Centres in support of search and rescue operations.
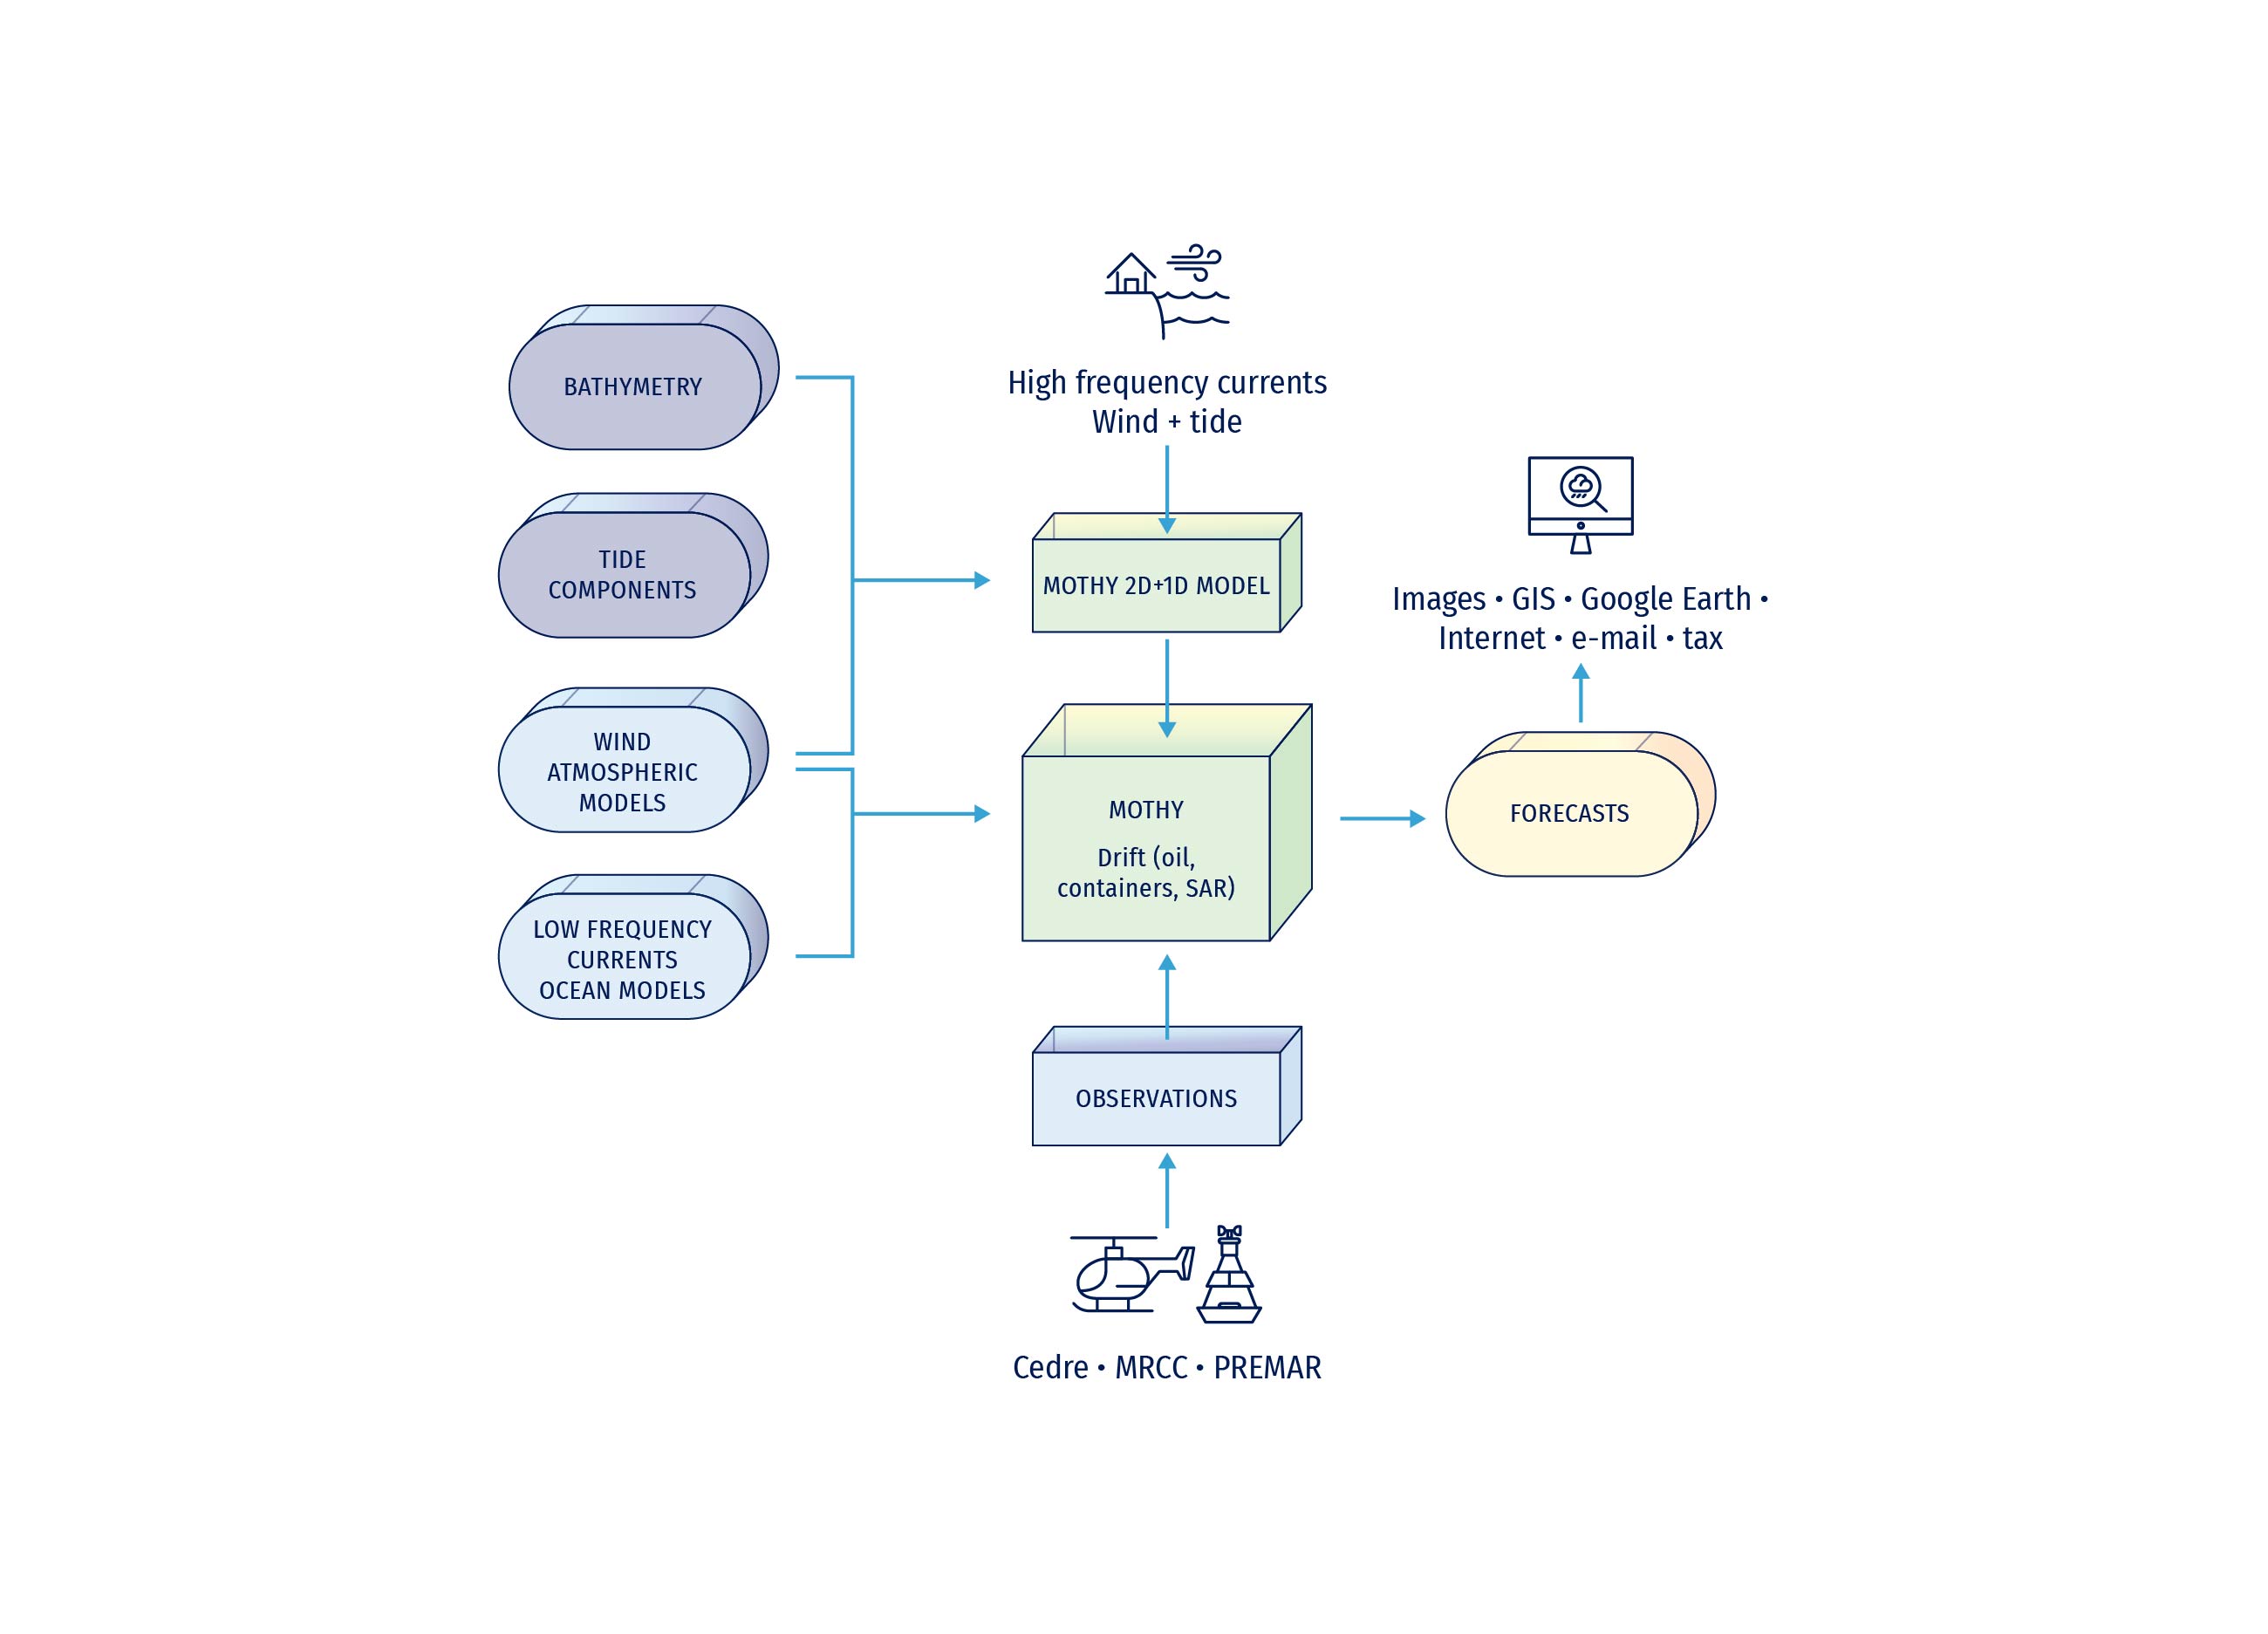
Figure 11.5. General diagram of the MOTHY system. Blue: static data. Green: data sets stored in the MétéoFrance database; includes all Météo-France/ECMWF atmospheric models and Copernicus Marine ocean models.
MOTHY has been operational since 1994 and was widely used during the Erika 🔗12 (December 1999), Prestige 🔗13 (November 2002), and Grande America 🔗14 (March 2019) crises. The system is activated about 20 times a week for actual spills or search and rescue operations. The search for objects or people constitutes almost three quarters of the applications.
The model is regularly updated and improved. MOTHY includes a Lagrangian model with the possibility of backtracking. The 3D version takes into account vertical buoyancy- and turbulence driven movement. There are 3 components:
- oil or any substance that drifts like a slick, including vegetable oil or a few chemicals;
- cargo containers;
- search and rescue targets.
Drift predictions depend primarily on reliable and timely access to observed and predicted environmental data. From this point of view, Météo-France is equipped with the best atmospheric models:
- The AROME limited area model covers the entire French coastline, with a 1.3 km resolution around France and 2.5 km around the French overseas territories;
- The ARPEGE 🔗15 global model with variable mesh (1/10 ° or 1/2 ° depending on the area), centred on France, for forecasts over the European seas and near Atlantic;
- The IFS 🔗16 global model of the ECMWF has a resolution of 1/8° and GFS at 1/4 ° in R&D mode.
and ocean models:
- Global ocean system by Mercator Ocean International 🔗17 with a resolution of 1/12°;
- Regional systems (IBI at 0.028°×0.028° resolution, MedFS at 0.042°×0.042° resolution, Atlantic-European NWS at 0.014°×0.03° resolution);
- SCHISM in New Caledonia (1/200° resolution).
The MOTHY model, which calculates the three-dimensional drift of surface and subsurface oil, is a "superparticles" model. Superparticles are seeded at each time step, according to the specified location, duration, and rate of release. Being operated by Météo-France's Marine Forecasting service, MOTHY is free for the French authorities and certain foreign weather services as a part of their public service mission. After requesting an account, users can freely perform modelling in the Channel - North Sea on the Noos-Drift online platform: 🔗18.
11.2.2.2
WITOIL
WITOIL (Where Is The Oil) is a multi-model oil spill forecasting service providing predictions on transport and transformation of actual or hypothetical oil spills for the global ocean, the regional European Seas, and selected coastal areas (Figure 11.6). Being an interactive system, WITOIL requires the input of data about atmospheric winds, sea surface temperatures, and sea currents.
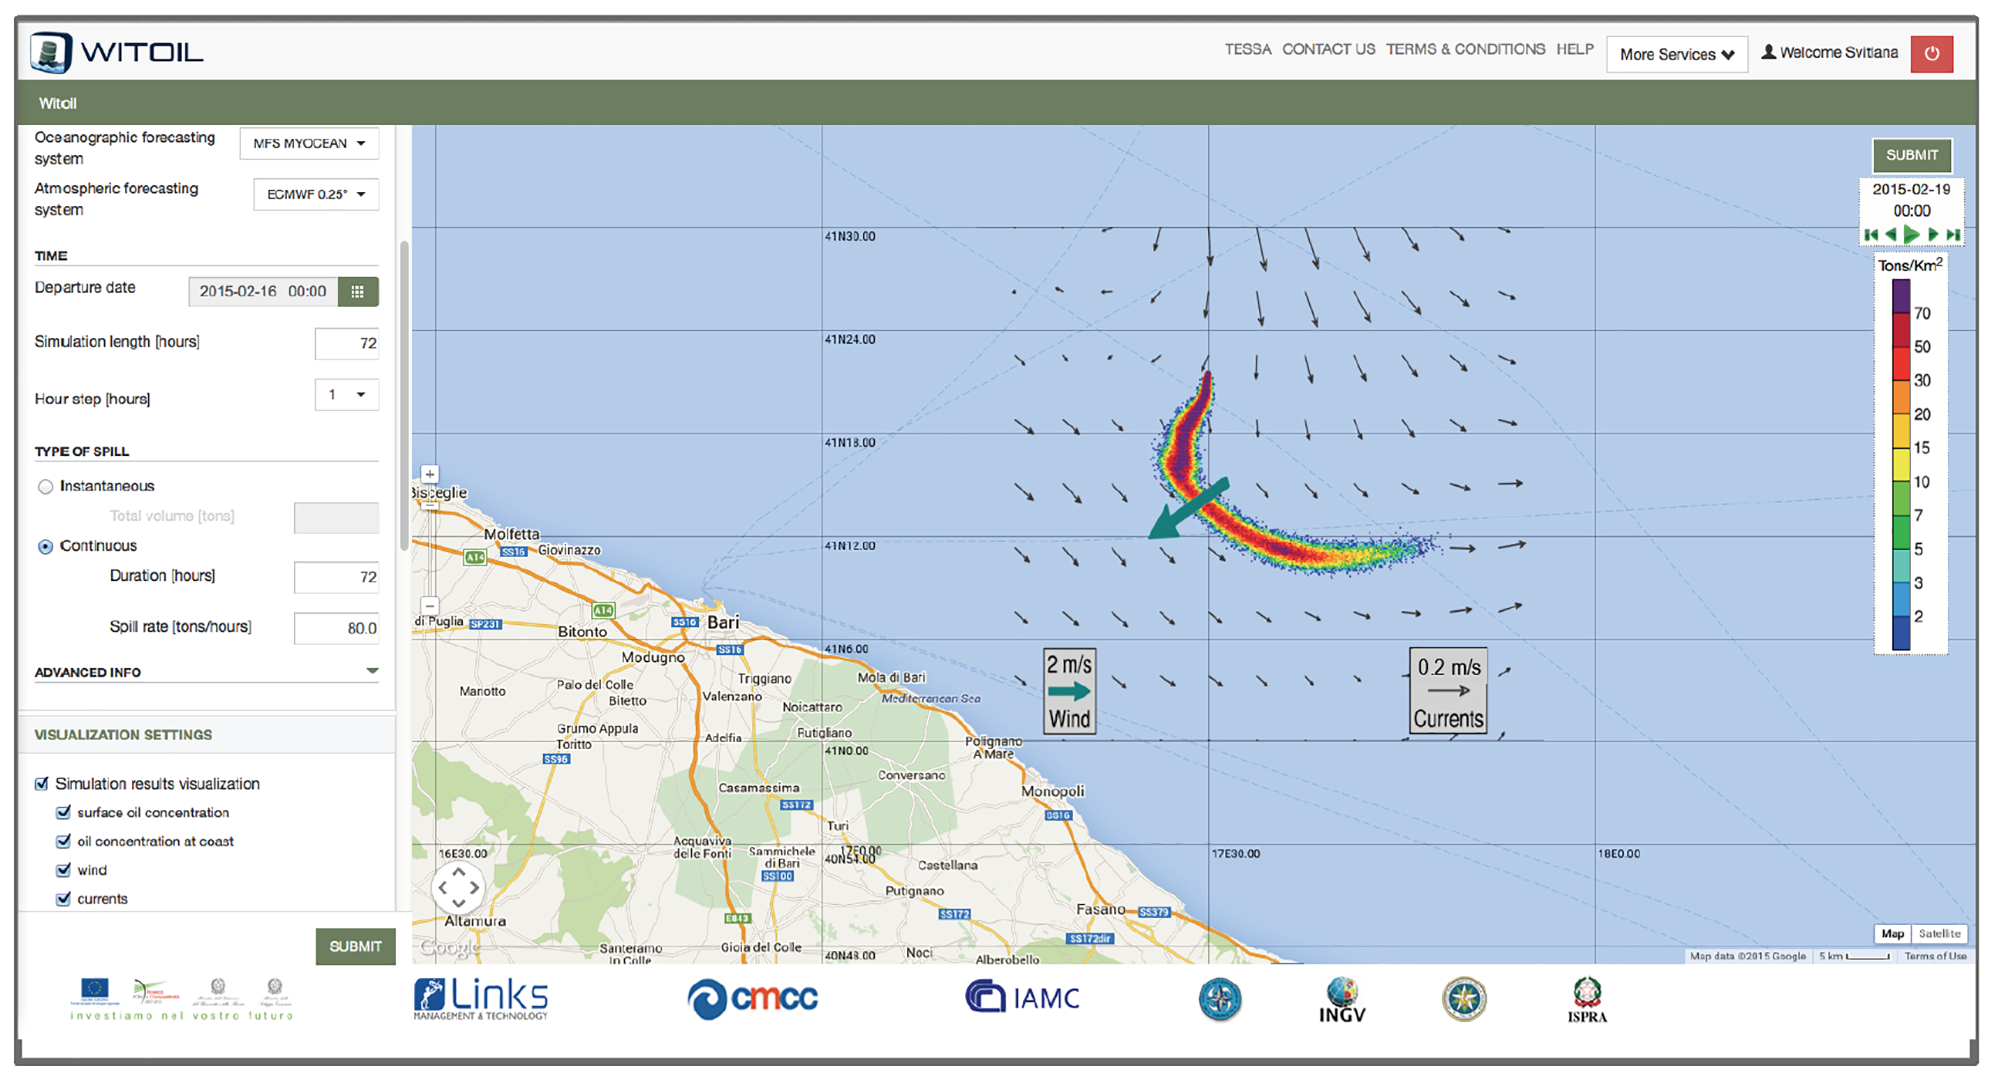
Figure 11.6. Example of the user interface and results of the WITOIL oil spill forecasting application.
WITOIL provides users with spatial-temporal distributions of oil concentration at the sea surface and on the coastline. WITOIL output consists of graphics and animations available through web browser and downloadable products (both ocean and atmospheric fields and oil slick simulation outputs). Moreover, WITOIL provides an interoperable service that can be accessed from and integrated in any GIS system.
Data used in the WITOIL application are: i)the atmospheric wind data from ECMWF provided by Italian Aeronautica Militare at a resolution of 1/10°: 6-hourly analysis, 1 hour for the first 3 days of forecast, 3 hours for the following 3 days of forecast, and 6 hours for the last 4 days of forecast; and ii) the ocean current and SST data are provided by the Copernicus Marine Service.
In particular, the following domains and ocean products are used in WITOIL:
1. The Global Ocean at 1/12° (from Copernicus Marine Service) and 1/16° (GlobalOcean Forecasting System by CMCC);
2. Mediterranean Sea using the MedFS products at 1/24° horizontal resolution from Copernicus Marine Service;
3. Black Sea using the BSFS products at 1/40° horizontal resolution from Copernicus Marine Service;
4. Baltic Sea using the Baltic Sea Forecasting System at 0.028°×0.017° horizontal resolution from Copernicus Marine Service;
5. Southern Adriatic and Northern Ionian Sea coastal areas using the CMCC SANIFS (🔗19), based on the SHYFEM unstructured grid ocean model, reaching a horizontal resolution of 10-100 m in the coastal areas;
6. Several areas in the Persian Gulf using the CMCC ocean forecasting systems based on SHYFEM, reaching a horizontal resolution of 10-100 m in the coastal areas.
Free-access WITOIL version, a web-based application at 🔗20, is available for the Mediterranean Sea in English, Italian, French, Spanish, Arab, Greek, and Russian. Advanced multi-model WITOIL version is available upon request: 🔗21.
Various systems collaborated to provide information support for a recent oil spill. On 25th July 2020, the MV Wakashio hit a reef and ran aground off Pointe d'Esny on the southeast coast of Mauritius, in the Indian Ocean (Figure 11.7). In the morning of 6th August, oil leaked out of a fuel tank and oil pumping operations were carried out. They were completed on 12th August. On 16th August, the ship broke in two. On 19th August, the front part of the ship was towed about 20 kilometres from the coast. It sank on 24th August.
Following a request from the Mauritian authorities for assistance from France, the Prefect of the Reunion Island, activated a crisis cell. Meteo-France was then involved to forecast the oil drift (Daniel and Virasami, 2021). Also CMCC and MOI produced oil spill simulations and forecasts with WITOIL and sent them to relevant authorities.
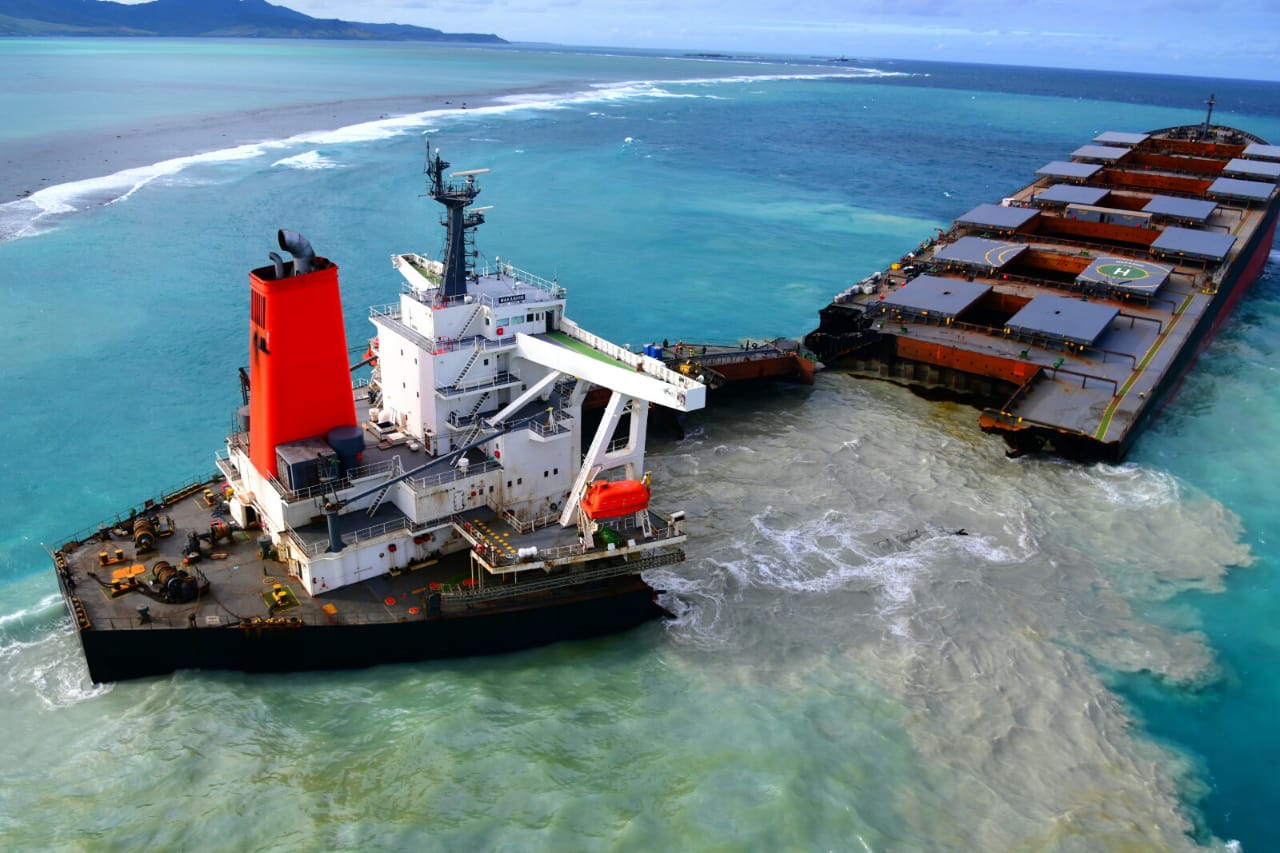
Figure 11.7. A recent oil spill emergency: the August 2020 incident in Mauritius.
11.2.3
Ports
Ports and activities linked to maritime transport, for both commercial and tourism purposes, have a significant economic value for coastal countries. Ports may be affected by very serious environmental issues that have consequences on the safety of port activities, as well as be a vehicle for concentration and dispersal of alien species through ballast waters.
11.2.3.1
SAMOA service for Spanish ports
Approximately 85% of imports and 60% of Spanish exports are channelled through ports, and such figures highlight the vital role they play in the national economy. The ports suffer the extreme events of the main physical variables, in particular wind, waves, and sea level. These phenomena affect the installations throughout all phases of the port life, from design to operation. To respond to these complex needs, the Spanish Puertos del Estado and Port Authorities co-financed the SAMOA initiative.
SAMOA fully integrates a comprehensive set of products in a specific visualisation tool that is managed by administrators in the harbours. It also includes an alert system via e-mail and SMS, fully configurable by the port community users. In addition, an extended set of applications, such as oil spill models and air pollution monitoring tools, have been fully integrated into the system.
The main functions of the system are: 1) provision of information for knowledge-based operation of infrastructures (e.g. forecast of port closure due to extreme events); 2) aid for pilot operations; 3) safer and more efficient port operations (e.g. crane operations affected by winds and planning of Ro-Ro operations); 4) fight against oil spills in the interior of the harbours; and 5) control of water and air quality.
SAMOA is heavily relying on previously existing Puertos del Estado monitoring networks (25 buoys, 8 HF radars and 40 tide gauges) and it has been used to detect and fill gaps, improving the coverage of meteorological stations on the ports, and the control of the tide gauges by means of continuous GNSS.
The SAMOA wave component has been designed to provide a three-day forecast of agitation (significant wave height in the interior of the port) inside 10 Spanish ports of special interest: Almería (two ports), Gijón, Las Palmas (three ports), Málaga, and Santa Cruz de Tenerife (three ports). Prior to SAMOA, Puertos del Estado was running an operational wave forecast able to provide, using the SWAN model, wave forecasts at the harbours mouth. Thanks to the development of SAMOA, this forecast has now been downscaled to the interior of the ports at extremely high resolution (2 m).
The SAMOA circulation component produces daily a shortterm (three-day) forecast of three-dimensional currents and other oceanographic variables, such as temperature, salinity, and sea level for nine Spanish ports in the Mediterranean (Barcelona, Tarragona, Almería), the Iberian Atlantic (Bilbao, Ferrol), and the Canary Islands (Las Palmas, Tenerife, La Gomera, and Santa Cruz de la Palma). The three-dimensional hydrodynamic model used in the SAMOA circulation component is the ROMS (Shchepetkin and McWilliams, 2005).
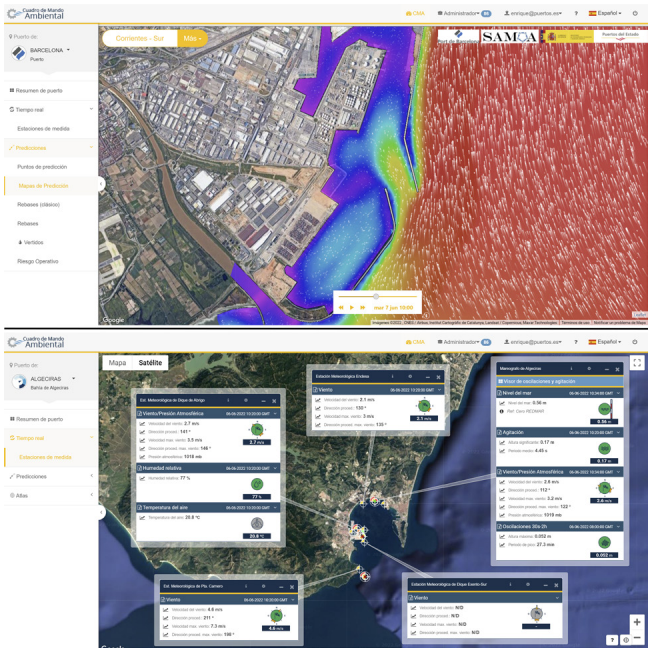
Figure 11.8. The SAMOA visualisation tool, showing the circulation at Barcelona Port (upper panel) and the real-time measurements at Algeciras Harbour (lower panel).
The SAMOA model outputs are freely accessible through the Puertos del Estado’s THREDDS catalogue (the THREDDS is a web server that provides access to data and metadata for scientific purposes using a variety of remote data access protocols). Likewise, free access to some products is granted via a web interface (🔗22). Additionally, a specific tool for port authorities - the CMA shown in Figure 11.8) - has been developed to properly exploit all SAMOA products and so far has been implemented in 46 ports. The CMA, developed by Nologin Ocean Weather Systems (🔗23), is based on a web interface (🔗24) and provides easy access to all information generated by the SAMOA systems, both in real time and in forecast mode. Users can define thresholds for all spatial points inside the application (model points and measuring stations) that are employed to trigger alerts. The CMA is also capable of creating custom PDF reports for each forecast point. Furthermore, a user-friendly oil spill model and an atmospheric dispersion model have been developed and incorporated into the CMA. Port managers granted access to the tool can define the level of permission allowed to users. For example, some users can get permission for visualisation, but might not have access to the oil spill model. The CMA is also used to configure personalised alert systems, defining the points and the alerts to be triggered, as well as the reception method (e-mail or SMS). The alerts can be defined as a combination of parameters, conditions, and/or thresholds as complex as desired by the user. A very good example of how the CMA tool should be used is the Algeciras harbour, in which it is utilised by a community of 500 users, including the companies located at the facilities.
Building on the success of SAMOA, a SAMOA 2 project is now on its final stage of implementation. This second phase will include new components, such as a wave overtopping forecast and extremely high-resolution wind prediction (2 m). In 2022, once SAMOA 2 is completed, the system will have the following components: 44 CMA implementations in different ports (of a total of 46 ports in the national system), 20 1-km resolution atmospheric forecasts, 21 agitation systems, 31 circulation systems, 19 new meteorological stations, eight GNSS, 15 very high wind forecast systems, plus other additional modules. Work is ongoing on how to use the new models to explore, for example, the wave current interactions.
With the new system in place, the most important challenge for the Spanish port system will be to implement the methodologies necessary to make proper use of all the new available tools. While some ports are very active and are already making good use of the new information, others are still not able to fully exploit it. Several initiatives will be launched to reduce this gap. Making operational oceanography a core part of the port management business is probably the most significant result of SAMOA.
11.2.3.2
AQUASAFE
The AQUASAFE platform (🔗25) aims to increase efficiency in management of maritime operations, providing real time information and its integration with forecast and diagnostics tools. This platform is operational for all Portuguese Ports and in the Port of Santos (Brazil). It is also used to support aquacultures, inland navigation, irrigation, and water utilities.
Measured data (sensors, remote detection, etc.) and modelled data (meteorology, hydrodynamics, waves, etc.) are integrated in a platform which synchronises all of them in time, space and dimensional units to provide easy and robust access to real time and forecast information. The global architecture of the Platform is presented in Figure 11.9.
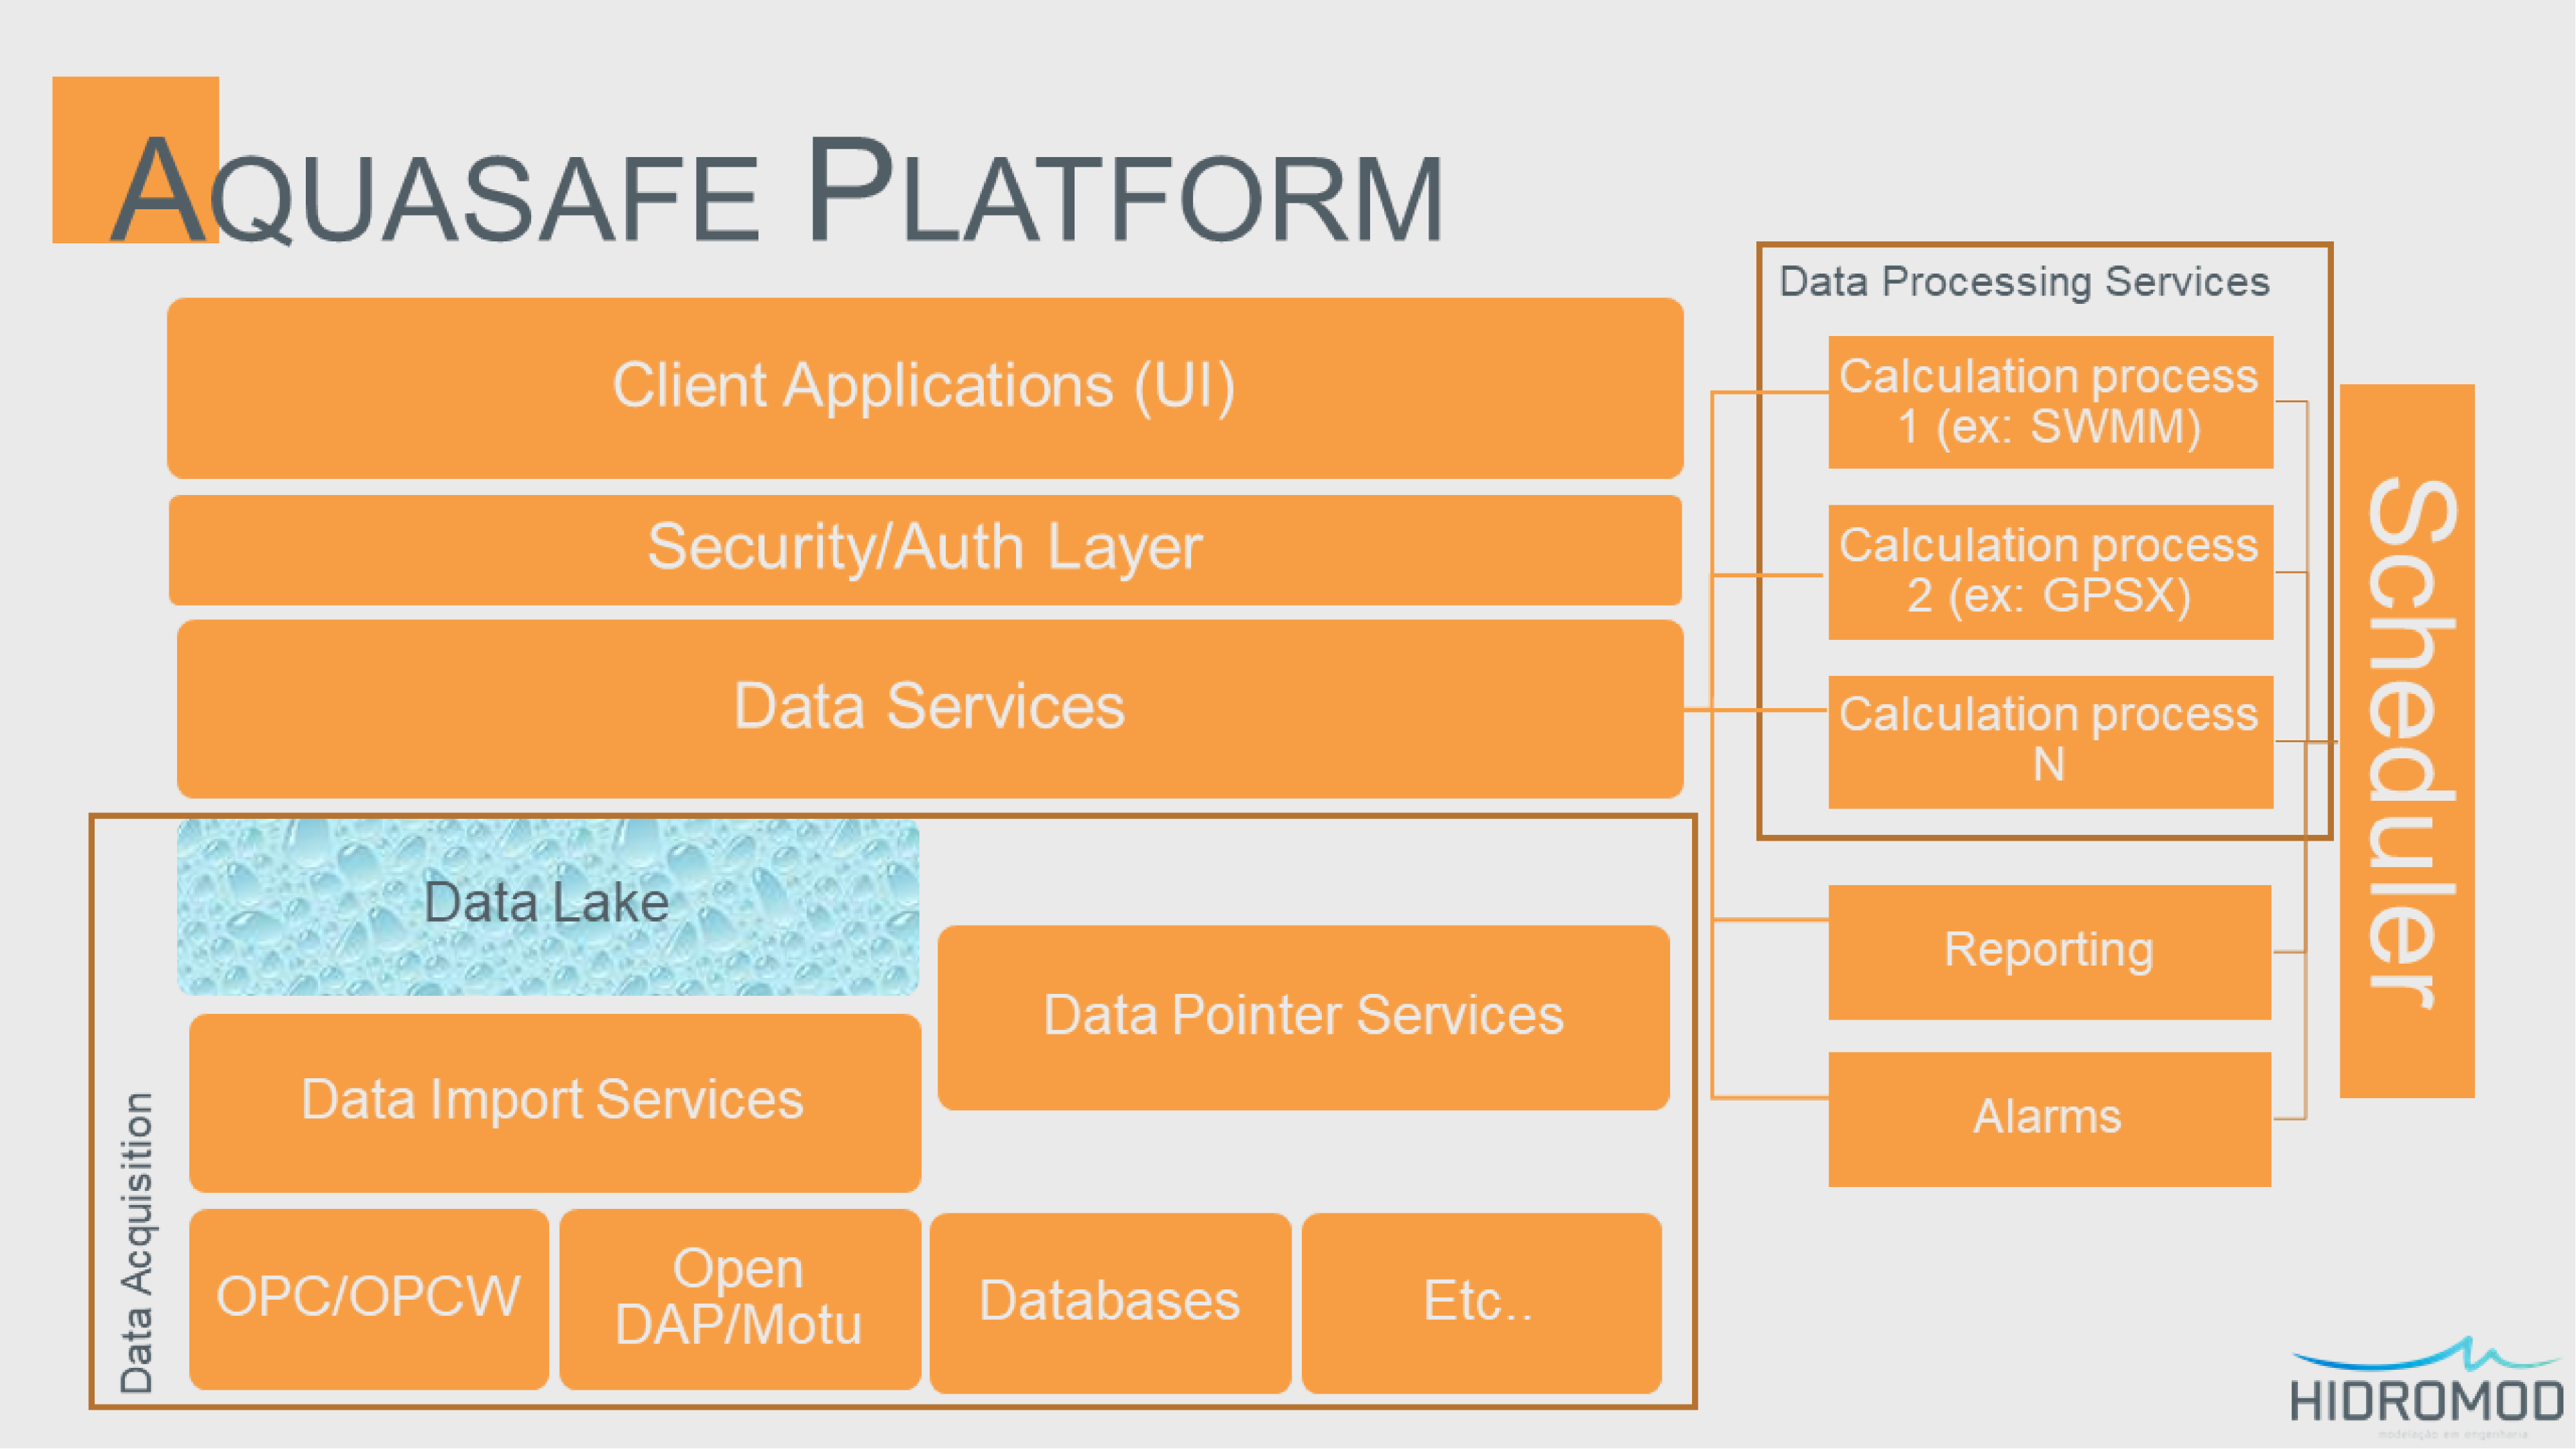
Figure 11.9. Architecture of the AQUASAFE platform.
AQUASAFE has a micro-service, cloud native architecture. Each one of the platform's components (data download, data formatting, model execution, etc.) is implemented in a completely isolated way, facilitating both its maintenance and scalability. It also uses Container technology (from Docker) so that each component is portable and consistent and can be quickly instantiated.
The Client Applications (User Interfaces) connect to Data services via a state-of-the-art authentication layer. A Data services layer is managing the Data acquisition (ingestion of data from external systems to the platform, and storage) and the Processing Services (which performs computational loads that generate new data). It also manages Reporting and Alarms. Data Processing Services, Reporting and Alarms are processed through a common Scheduler.
Using this system, port operations have better efficiency and safety as it improves the match between tight schedules of container ships, or tight security of liquefied natural gas (LNG) carriers, and the operational weather limits of each Terminal. Thus, the impact in the logistic chain including ports is extremely positive.
In this context, PIANC’s Maritime Navigation Commission Working Group 54 produced a set of recommendations “on the use of hydro/meteo information for navigational channel and port basin operations, including the determination of operational limits” (PIANC, 2012). The AQUASAFE platform was developed along those recommendations.
Hydrodynamics and wave propagation modelling methodology used in the operational systems implemented with AQUASAFE is based on downscaling global models to local scale, to correctly forecast parameters like sea level, currents, or waves (Figure 11.10). Meteorological forecasting also has a similar approach, but institutes or companies specialised in meteorology are usually used as data suppliers (e.g. MeteoGalicia).
This downscaling methodology is also embedded in the concepts behind some modelling systems like WRF (atmospheric model) or SWAN (waves nearshore).
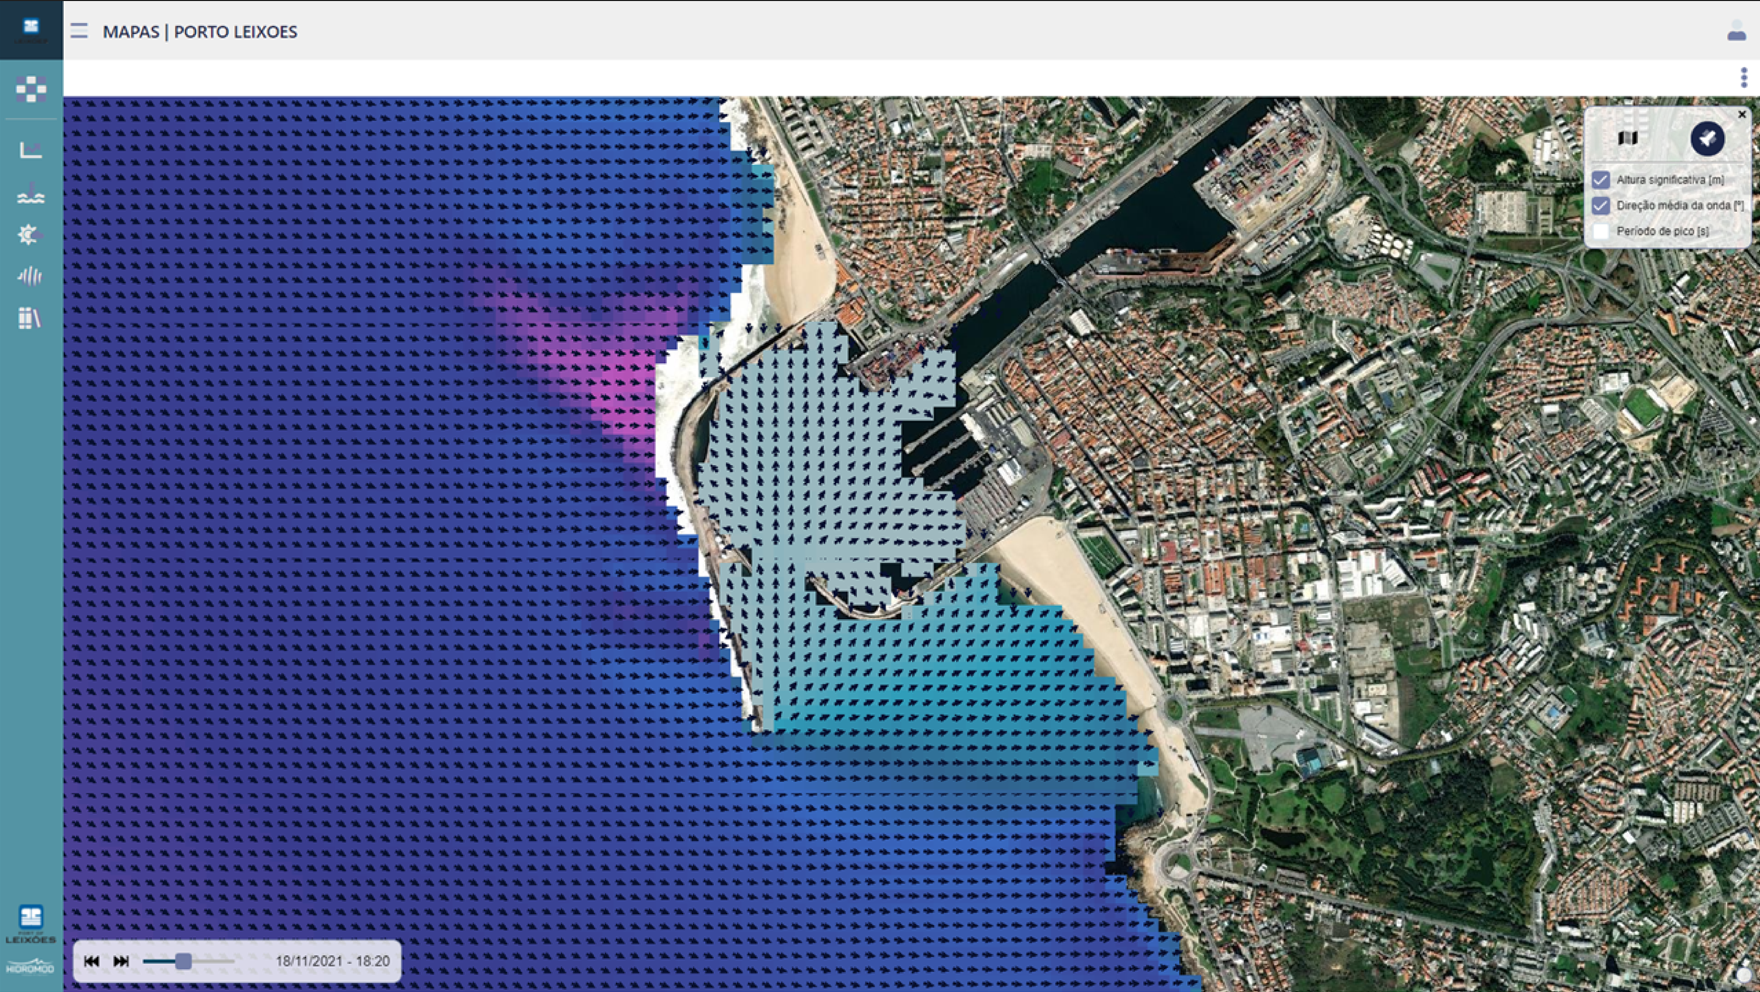
Figure 11.10. AQUASAFE platform: wave model at the Port of Leixões (Portugal).
11.2.4
Voyage planning
Shipping moves the global commerce as, according to UNCTAD, around 80% of the volume of international trade in goods is carried by sea 🔗26. This tremendous effort comes with a significant environmental footprint. According to the Fourth GHG study of the IMO, shipping accounted in 2018 for nearly 3% of global anthropogenic CO2 emissions. Container ships, bulk carriers, and oil tankers are the greatest emitters of the world fleet. When it comes to per-ship emissions, cruise ships also distinguish themselves for their carbon footprint.
Various measures are presently discussed both at IMO 🔗27 and at the European Union level 🔗28 for reducing the GHG emission from shipping. In the short term (i.e. the current decade), more efficient operations for both old and newbuild ships would be possible via a blend of design and operational measures. Among the operational ones, both speed limitation and voyage planning could be considered. Speed limitation leads to reduction in emission at the cost of longer voyage durations, and could be viable for delivering non-perishable goods. However, for all ship types, the environmental benefits of speed limitation could be enhanced through voyage planning or weather routing. This wording may refer to quite different systems supporting the definition of the route to be sailed. It is possible to distinguish among:
- Strategic/Tactical planning. The former refers to optimally deploy the fleet of a given shipowner to pursue some benefit, while the latter to the shape of a specific route between given ports of call;
- Global/Local optimization. The former refers to optimise some figure of merit integrated along a voyage (such as total voyage GHG emissions), while the latter to locally constrain the vessel behaviour (wind, waves, or ship motions below a given threshold);
- Single/Multiple Objectives. In the former case, the optimization objective (such as emissions, duration, cost, and comfort) is one at time, while in the latter multiple, conflicting objectives can be addressed (usually making use of some mathematical compromise);
- Deterministic/Stochastic. In the former case, an algorithm is used to deliver exactly the same solution for given boundary conditions (usually a proof of optimality is available), while in the latter stochastic approaches (such as genetic ones) are used for speeding up computations at the cost of losing full optimality and reproducibility.
In most items of the above taxonomy, voyage planning is related to weather and ocean state, both observed and predicted, to be used for either constraining the navigational options or defining the route’s optimization objectives. A recent joint IMO-WMO symposium 🔗29, highlighted that routing optimization may help ships to increase their operational efficiency and simultaneously reduce emissions, while it is especially relevant for safety of navigation in extreme marine conditions. Voyage planning tools are developed by several research organisations in various countries, such as (non-exhaustive list): Sweden (Li et al., 2021), Portugal (Vettor and Guedes Soares, 2016), Poland (Krata and Szlapczynska, 2018), Italy (Mannarini et al., 2016a), South-Korea (Lee et al., 2018). An attempt to classify ship routing models can be found in (Zis et al., 2020).
Finally, for its contribution to GHG emission reduction, voyage planning embeds a potential to contribute to several targets of the UN Sustainable Development Goals (🔗30), notably to 12.2, 12.4, and 13.
11.2.4.1
VISIR
The VISIR is a voyage planning model developed since 2012 by the CMCC and the University of Bologna. It can be defined as a tactical, global-optimization, single-objective, deterministic model system for ship route planning. It is based on an exact graph-search method (Dijkstra’s algorithm) modified for dealing with dynamic environmental fields. It is coastline- and sea-bottom-aware, thanks to a masking procedure in preparing the graph. It was used for both motor and sailboat routing in the Mediterranean Sea (Mannarini et al., 2016) and in the Atlantic Ocean (Mannarini and Carelli, 2019). So far, VISIR has been used in conjunction with both analysis and forecast wave and current fields from Copernicus Marine Service, and with wind fields from ECMWF or COSMO-ME (Mannarini et al., 2015).
In its first version, VISIR computed only least-distance and least-time routes. However, starting from version 2, also a least-CO2 route algorithm was embedded into VISIR. VISIR-1 used polar plots for representing sailboat speeds through water (STW) in dependence of wind magnitude and direction (Mannarini et al., 2015), while wave fields were used for motorboat routing (Mannarini et al., 2016). VISIR-1-b made use of sea surface currents for correcting STW for sea current drag and drift (Mannarini and Carelli, 2019). Starting from VISIR-1b, the angular resolution of the routes was enhanced thanks to a higher degree of connectivity of the underlying graph. While all VISIR-1 versions are based on a parametrization of calm water and wave added resistance for motorboats, VISIR-2 can alternatively make use of a ferry response model derived from a ship simulator. This allows for inclusion of wind-wave angle of attack, a more accurate representation of involuntary speed loss in waves, as well as of fuel consumption and CO2 emissions (Mannarini et al., 2021).
The validation of the path planning component of VISIR was performed via both analytical benchmarks (Mannarini and Carelli, 2019) and model inter-comparison (Mannarini et al., 2019).
VISIR is an open-source model and its updates are usually released upon documentation on peer-reviewed publications. In Table 11.1 is provided an overview of VISIR features across its versions (🔗31). So far, only version 1.a and 1.b have been released, which were coded in Matlab. However, the model version currently being developed is coded in python. VISIR-2 powers an operational service for ferries in the Adriatic Sea, available at 🔗32).
Table 11.1. Overview of features in VISIR model versions.
| Version | Released | Language | Ship model | Fields | Angular resolution | Objectives |
|---|---|---|---|---|---|---|
| 1.a | 2016 | matlab | Semiempirical parametrization of resistances | Waves (height, period) | 26.6º | distance, time |
| 1.b | 2019 | matlab | Semiempirical parametrization of resistances | Waves (height, period) & currents | 7.1º or better | distance, time |
| 2.a | >2021 | python | Semiempirical parametrization of resistances or fitted ship simulator response | Waves (height, direction) & currents | 14.0º or better | distance, time, CO2 |
In Figure 11.11 an example of optimal routes from the most recent version of VISIR is displayed.
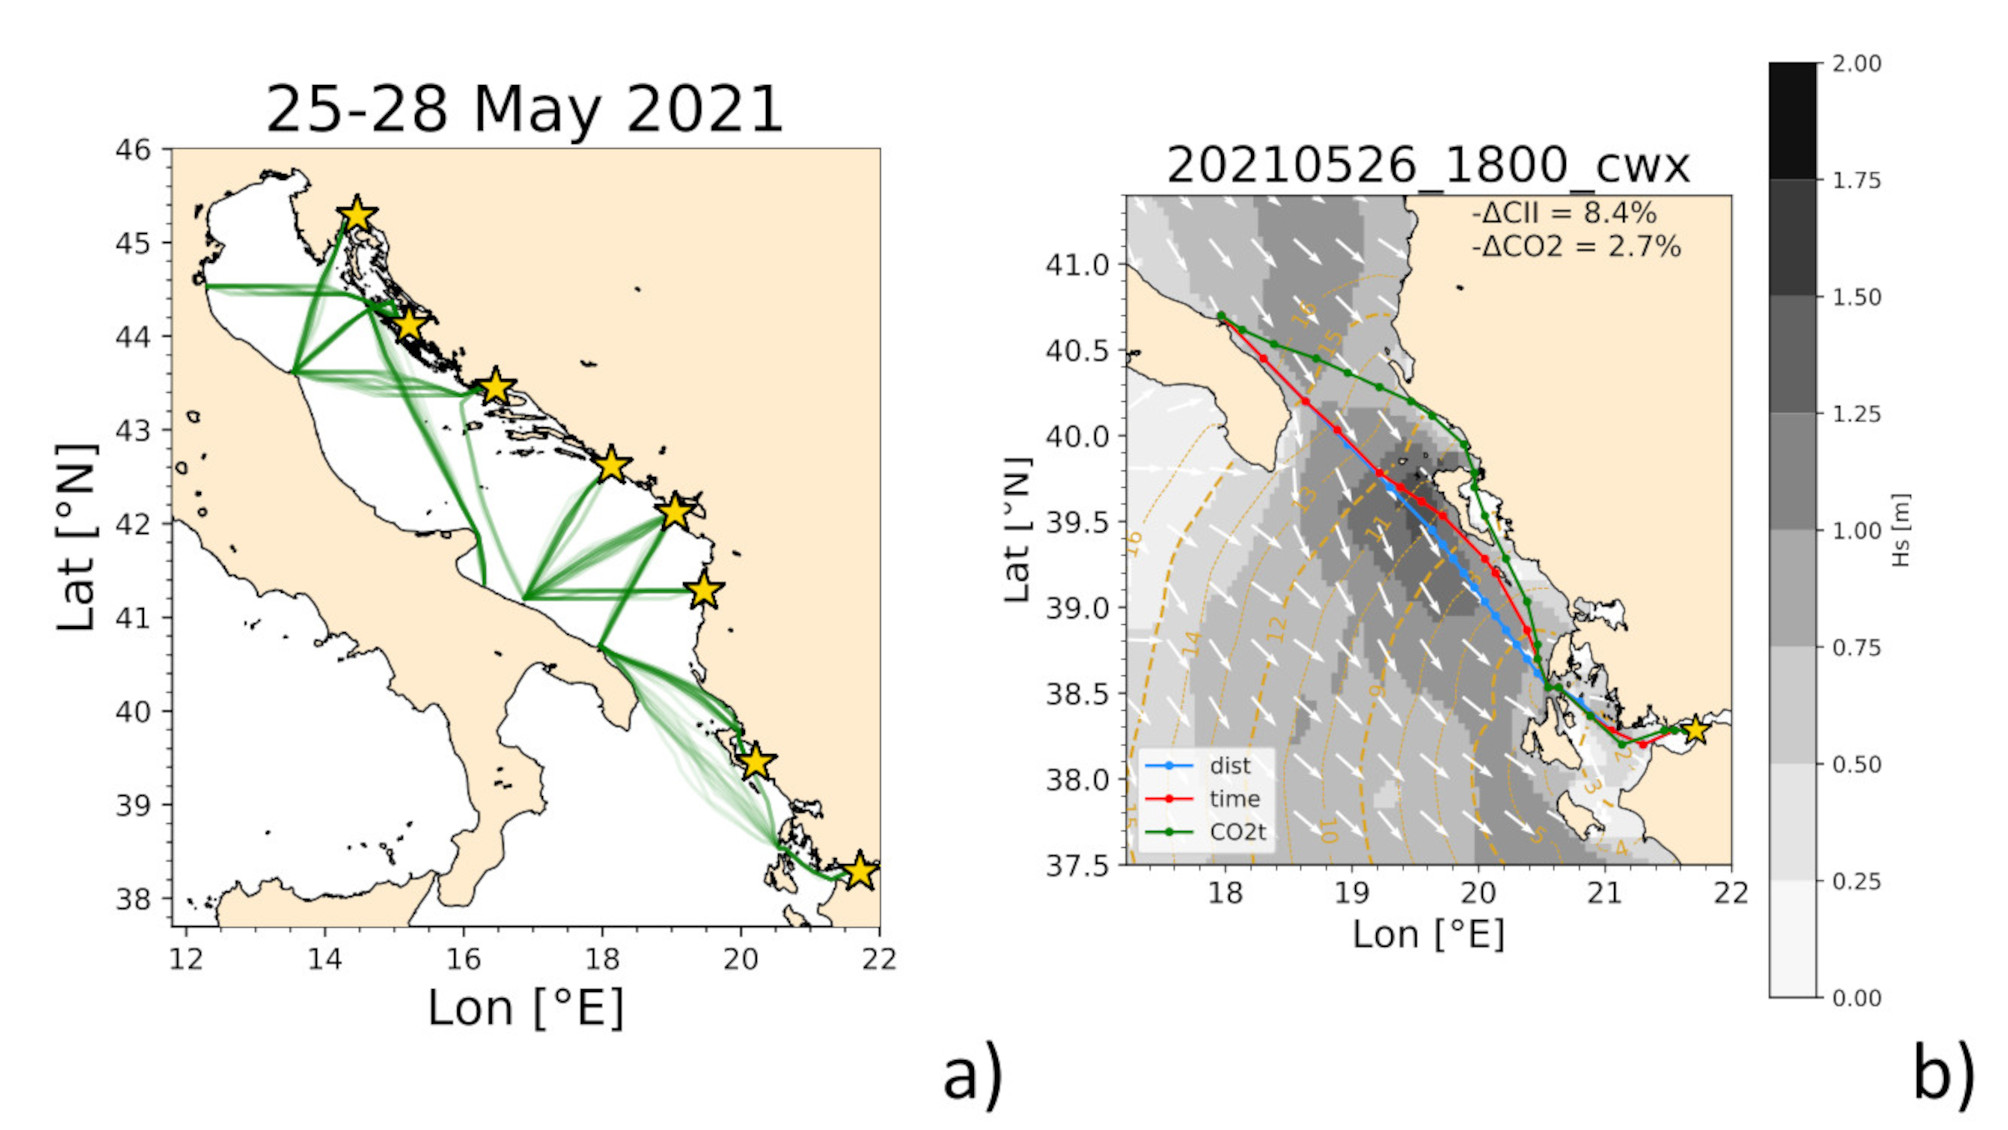
Figure 11.11. Optimal routes for a ferry of 125 m, computed via VISIR-2. Left panel: bundles of East-bound CO2-optimal routes for 25 departure times any 3 hour and three engine load values (70, 85, or 100% of maximum engine power). Right panel: least-distance (cyan), least-time (red), and least-CO2 (green) route from Patras (Greece) to Brindisi (Italy) for departure date and time as in the title and engine load at 70%. Relative CO2 and CII savings with respect to the shortest route are also indicated.
11.2.5
Fisheries and aquaculture
New technologies are developing for management and monitoring of fisheries, valorisation and protection of fish species, enhancing environmental standards for sustainable aquaculture, reducing wastes and improving safety, developing commercial platforms for direct selling of fish products, and tracing products in innovative ways. Another aspect to take into consideration is the characterization of fisheries and aquaculture products, with the purpose of diversifying products and innovating traditional practices. Information technologies can assist in the development of important systems to support the economic sustainability of the fishing industry, which may help fishers to guarantee the quality of products, as well as get information on sea conditions and on fishing models. In the following subsection are presented three examples on the use of operational oceanographic products for stock assessment, and management of fisheries and aquaculture.
11.2.5.1
Bluefin tuna
The SOCIB and the IEO have developed a habitat model for predicting spawning distribution of Atlantic bluefin tuna (Thunnus thynnus) in the Western Mediterranean. Observed data for larvae location are incorporated in a predictive system of the habitat model, forced by operational oceanographic products from the Copernicus Marine Service, such as satellite altimetry and chlorophyll, as well as sea surface temperature and salinity from hydrodynamic models for forecasting the Bluefin tuna habitats (Alvarez-Berastegui, 2016; Ingram, 2018). Analysis, satellite data, and forecast by the MedFS, in situ data for OC, SST, and Total Allowable Catch set by ICCAT are used in the application. Description of the application is available at 🔗34.
11.2.5.2
Harmful algal bloom warning system
The Harmful algal bloom warning system provides near real-time forecast information for the aquaculture industry along Europe’s Atlantic coast, it is of vital importance for mitigating the effects of HABs. It was originally developed in the FP7 Asimuth project (Cusack et al., 2016), subsequently further developed in H2020 AtlantOS (Cusack et al., 2018) and Interreg Atlantic Area PRIMROSE (🔗35). The warning system has been operational at the Irish Marine Institute since 2013 and subsequently deployed in Spain by IEO and in Norway by the NIVA. HAB information is disseminated in the form of a weekly bulletin to a wide audience with plots easy to interpret and explanatory text. The EOVs are used to develop data products for the weekly HAB bulletin and include: phytoplankton biomass and diversity, sea surface temperature, ocean colour, ocean surface stress, sea surface height, subsurface temperature, surface currents, subsurface currents, sea surface salinity, subsurface salinity, and ocean surface heat flux. Other EOVs required to produce the HAB bulletin are the biotoxins and/ or phycotoxins produced by some phytoplankton species that can accumulate in shellfish. Numerical models, satellites and in-situ data are integrated and undergo expert interpretation before finding their way to the weekly bulletin.
11.2.5.3
Weather window tool
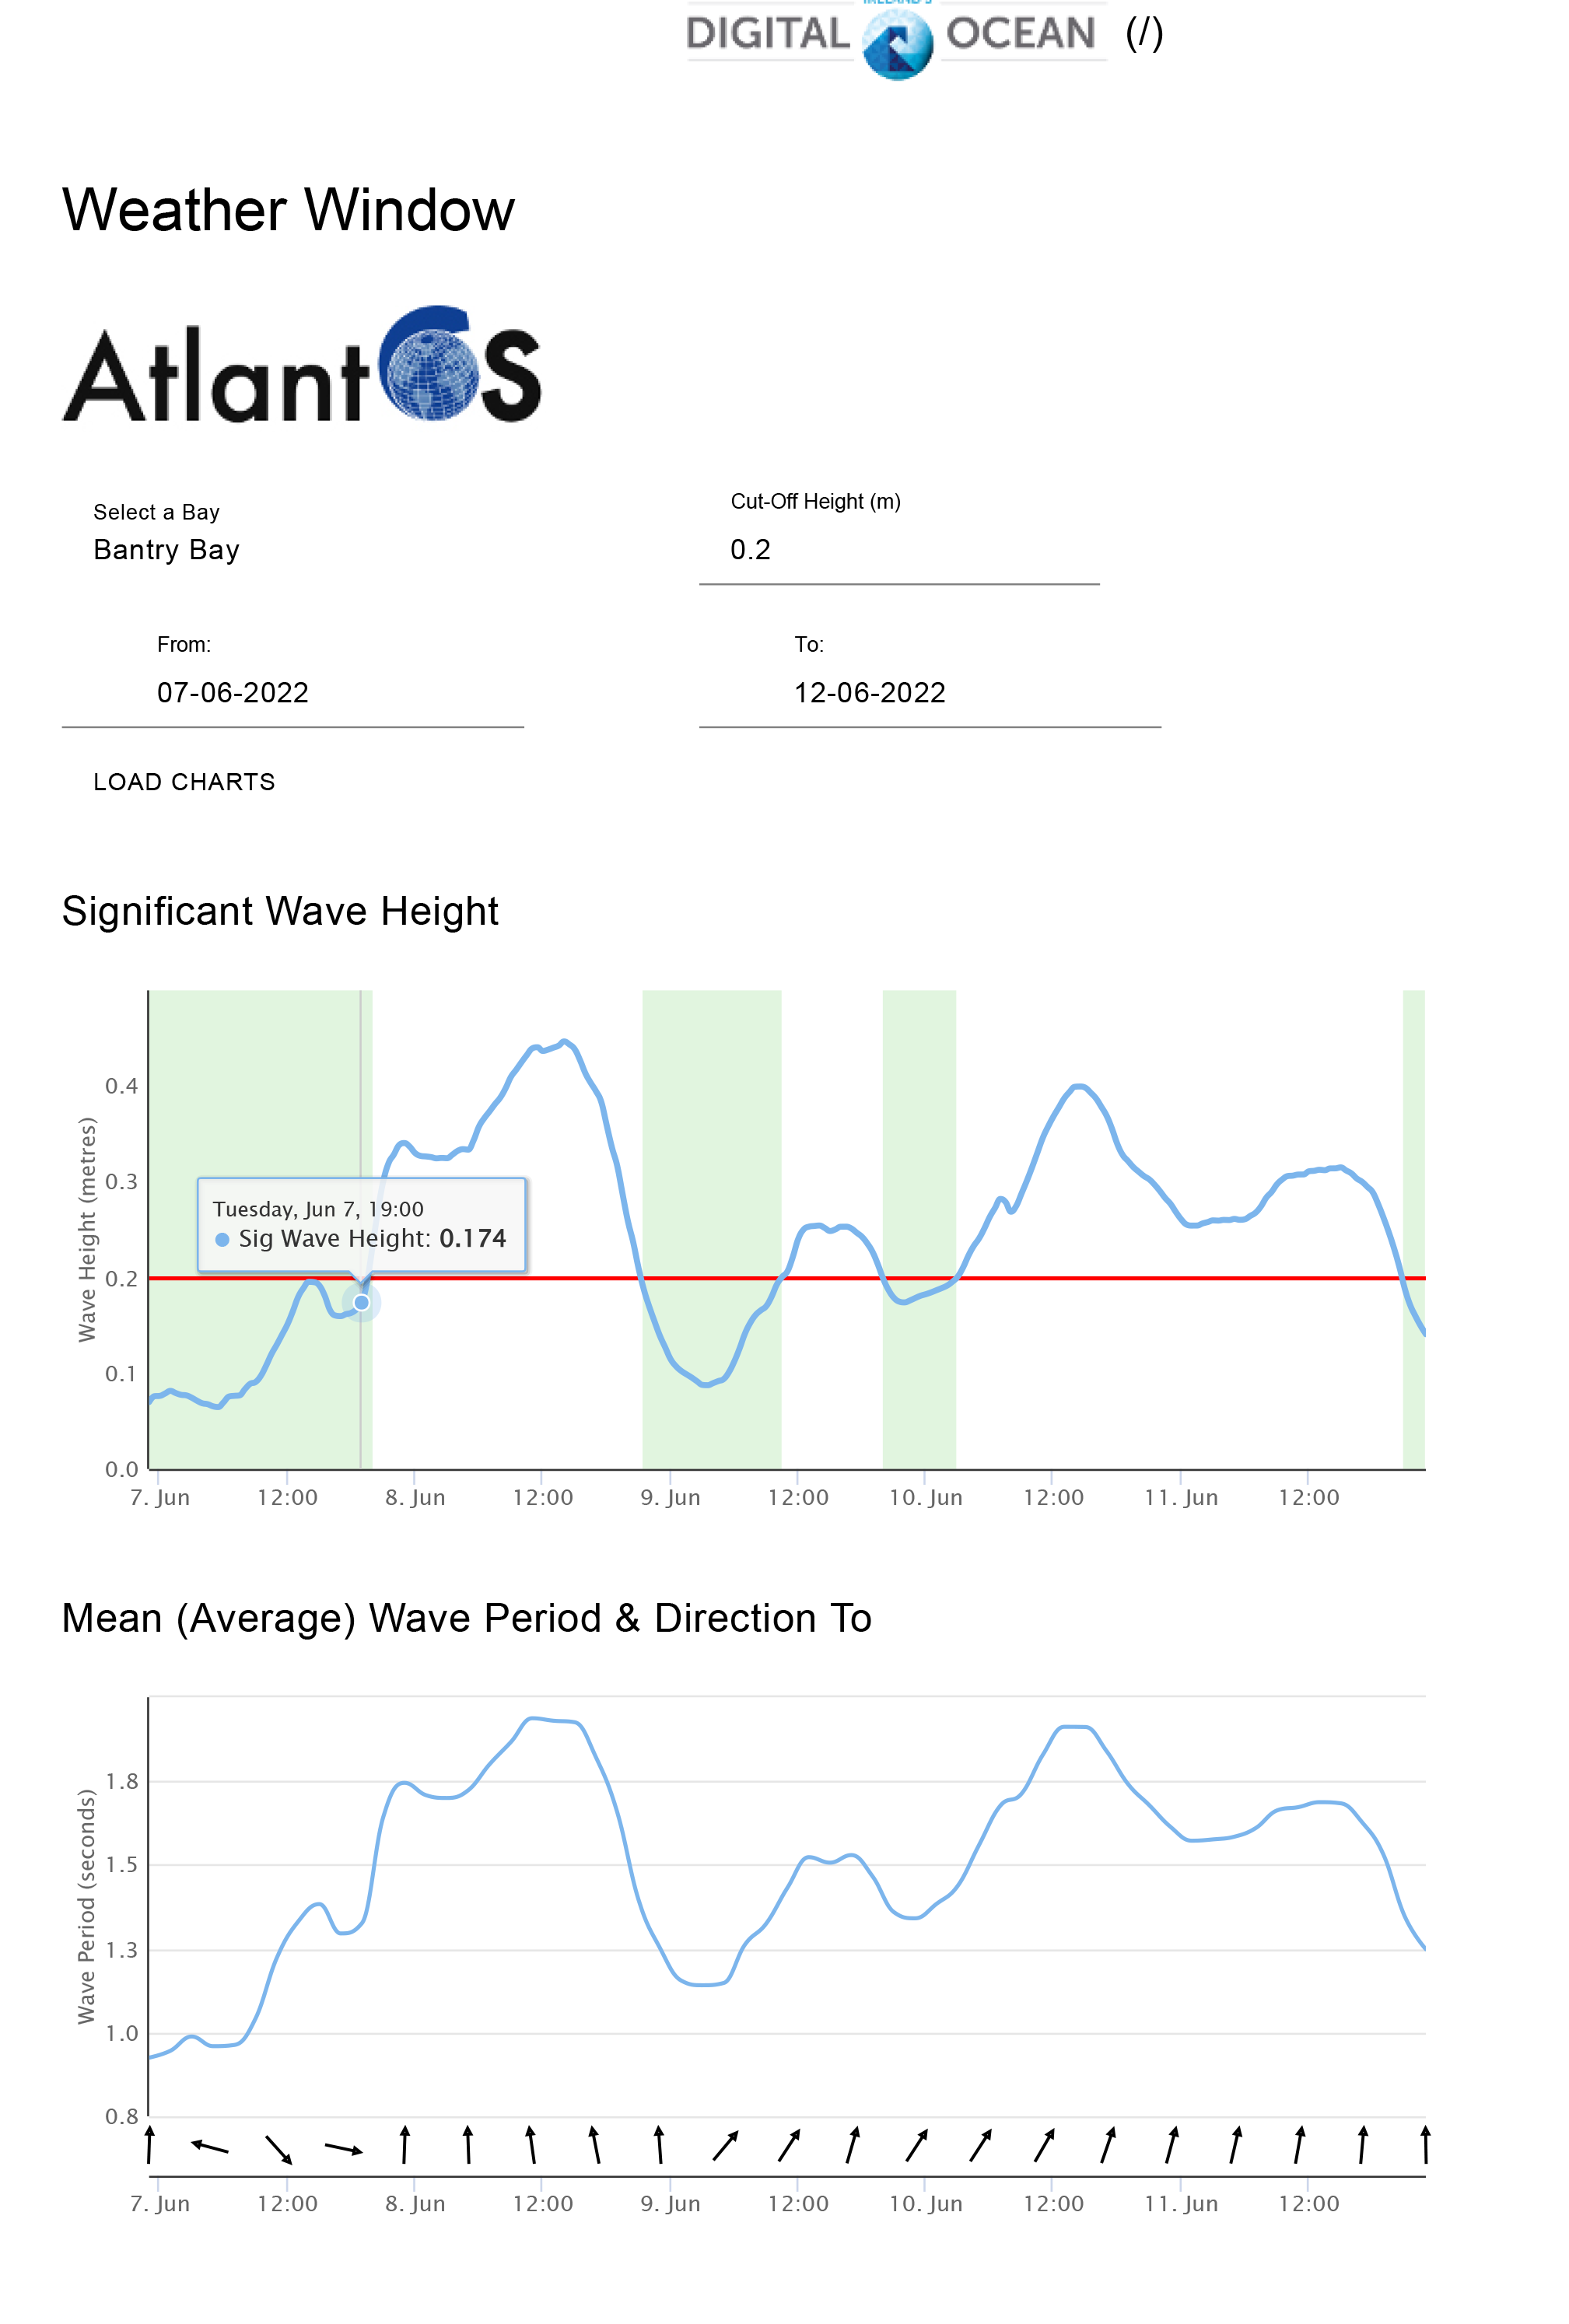
The Weather window tool provides a user-friendly interface to short-term wave forecasts. It was developed by the Marine Institute, Ireland, in the framework of AtlantOS (Dale et al., 2018) and is currently developed further in MyCOAST (Interreg Atlantic Area) to include more locations along the European Atlantic coasts. Availability of “coordinated” coastal observatories and forecasting models is the prerequisite for the transferability of this tool to other locations. To this aim, MyCOAST project developed a guideline to the standardisation of data from the observing and forecasting systems based on the NcML 🔗36). The user of the tool selects a location from a dropdown menu, inputs a cut-off wave height that is deemed by the user as safe for specific field activity at the site, and selects the time period up to a week (limited by the duration of wave forecast). Two graphs are then displayed: i) significant wave height time series with the cut-off height marked and safe dates and times coloured green; and ii) wave period and direction as a supplementary information. A snapshot of the tool is presented in Figure 11.12.
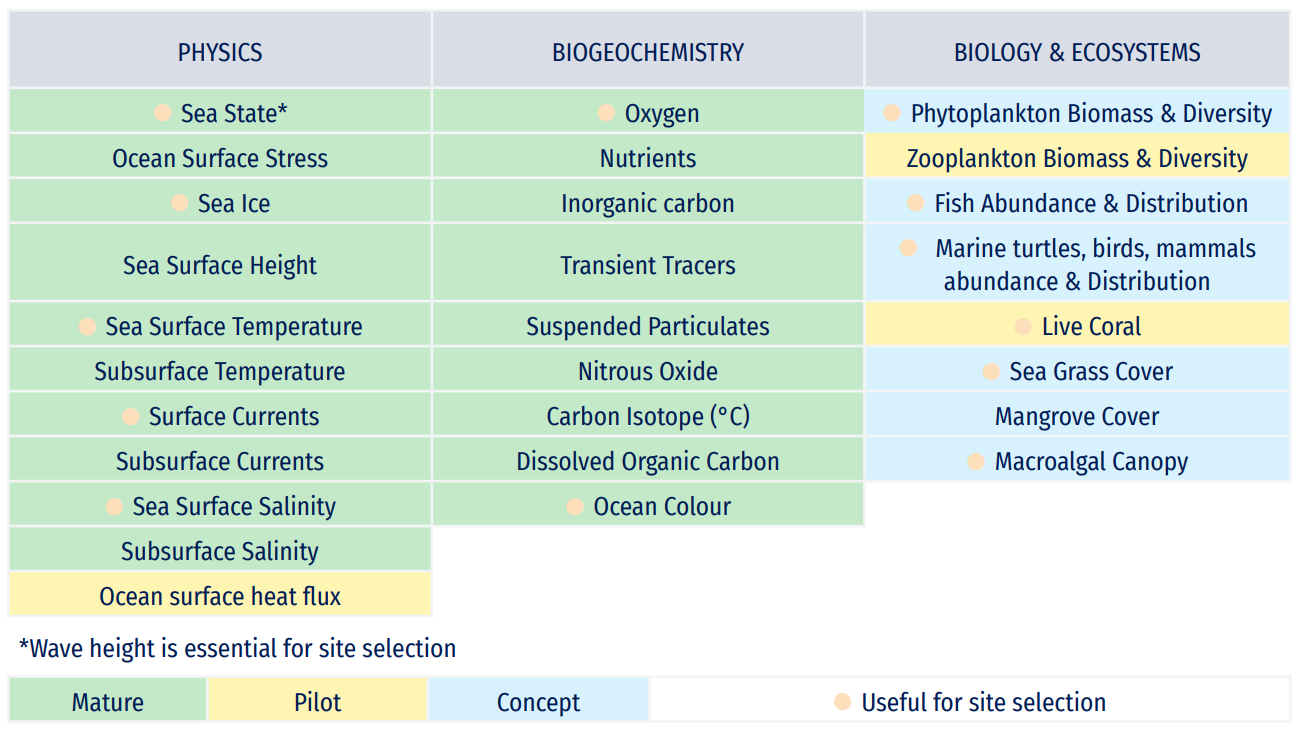
Table 11.2. List of physical variables for building the aquaculture site selection (source: Dale et al., 2017).
11.2.5.4
Aquaculture site selection
Aquaculture site selection is a key factor in aquaculture operation, including offshore aquaculture, and proper site selection is a prerequisite for the economic sustainability of the operation, for animal welfare, and for product quality. It is possible to base the identification of suitable sites for offshore aquaculture on observational and modelling systems. In response to the industry requirement, a relevant demonstration of this service was performed in the framework of AtlantOS (Dale et al., 2017). GIS approach has been used as it offers a means to organise, process, and analyse different data types and data models, as well as to perform a spatial multi-criteria evaluation. A set of criteria needs to be fulfilled for a site to be suitable for offshore aquaculture. These criteria, presented in Table 11.2, are related to physical factors like temperature, waves, and currents, as well as legal or administrative factors such as distance to ship routes, marine protected areas, offshore windmills, etc. A conceptual model of the aquaculture site selection approach using GIS is presented in Figure 11.13.
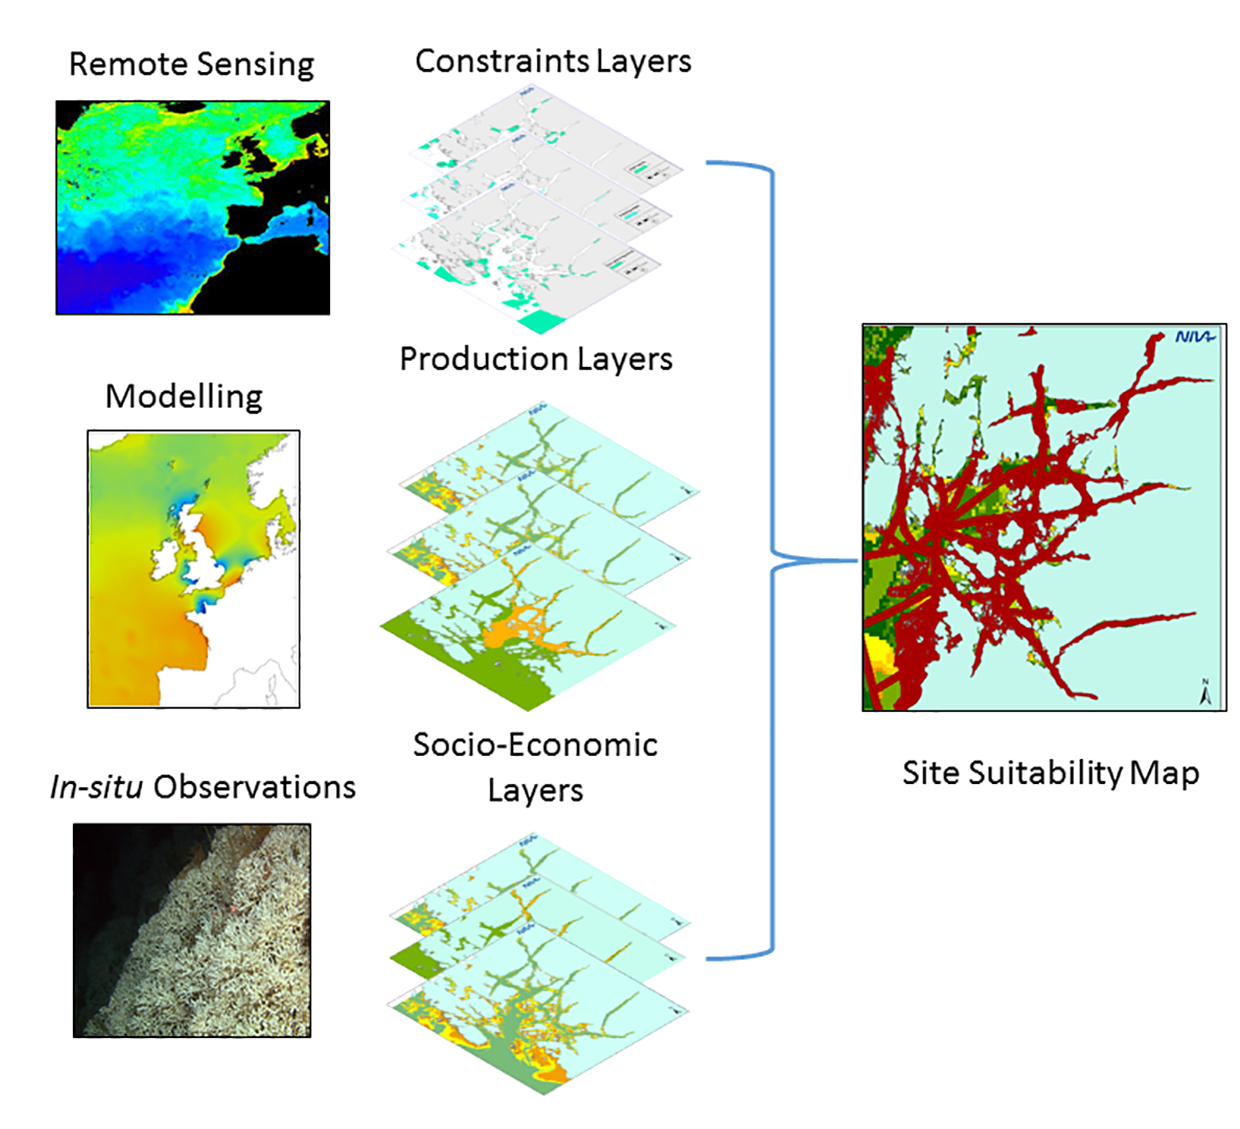
Figure 11.13. A conceptual model of aquaculture site selection approach using GIS (source: Dale et al. 2017).
References
Aamo, O.E., Reed, M., Lewis, A. (1997). Regional contingency planning using the OSCAR Oil Spill Contingency and Response Model. In Proceedings of the 20th Arctic and Marine Oil Spill Program (AMOP) Technical Seminar, Vancouver, BC, Canada, 11-13 June 1997.
Alvarez-Berastegui, D., Hidalgo, M., Tugores, M.P., Reglero, P., Aparicio-González, A., Ciannelli, L., Juza, M., Mourre, B., Pascual, A., Lopez-Jurado, J.L., García, A., Rodríguez, J.M., Tintoré, J., Alemany, F. (2016). Pelagic seascape ecology for operational fisheries oceanography: modelling and predicting spawning distribution of Atlantic bluefin tuna in Western Mediterranean. ICES Journal of Marine Science, 73(7), 1851-1862, https://doi.org/10.1093/icesjms/fsw041
Castanedo, S., Medina, R., Losada, I.J., Vidal, C., Mèndes, F.J., Osario, A., Juanes, J.A., Puente, A. (2006). The Prestige oil spill in Cantabria (Bay of Biscay). Part I: operational forecasting system for quick response, risk assessment and protection of natural resources. Journal of Coastal Research, 22, 1474-1489, https://doi.org/10.2112/04-0364.1
Coppini, G., De Dominicis, M., Zodiatis, G., Lardner, R., Pinardi, N., Santoleri, R., Colella, S., Bignami, F., Hayes, D.R., Soloviev, D., Georgiou, G., Kallos, G. (2011). Hindcast of oil spill pollution during the Lebanon Crisis, July-August 2006. Marine Pollution Bulletin, 62, 140-153, https://doi.org/10.1016/j.marpolbul.2010.08.021
Coppini, G., Gonzalez, G., Perivoliotis, L., Smaoui, M., Liubartseva, S., Bourma, E., Lecci, R., Cretì, S. (2018). MONGOOS-REMPEC operational experience during Agia Zoni II oil spill, September 2017. EGU General Assembly 2018, 8-13 April 2018, EGU2018-6745-1.
Cusack, C., Dabrowski, T., Lyons, K., Berry, A., Westbrook, G., Nolan, G., Silke, J. (2016). Harmful Algal Bloom warning system for SW Ireland. Part II: ASIMUTH-tailored model products, observations. Harmful Algae, 53, 86-101, https://doi.org/10.1016/j.hal.2015.11.013
Cusack, C., Silke, J., Ruiz-Villarreal, M., Eikrem, W., Dale, T., Moejes, F., Maguire, J., Chamberlain, T., Dabrowski, T., Gerritsen, H., Hynes, P., Leadbetter, A., Lyons, K., O'Rourke, E., Smyth, D., Miguez, B. M., Marty, S., McFadden, Y. and O'Toole, D. (2018). Harmful Algal Bloom Bulletins. AtlantOS Deliverable, D8.6, AtlantOS, 36 pp., doi:10.3289/AtlantOS_D8.6
Dagestad, K.F., Röhrs, J., Breivik, Ø., Ådlandsvik, B. (2018). OpenDrift v1.0: a generic framework for trajectory modelling. Geoscientific Model Development, 11, 1405-1420, https://doi.org/10.5194/gmd-11-1405-2018
Dale, T., Cusack, C. and Ruiz, M. (2017) Aquaculture site selection Report. AtlantOS Deliverable, D8.2, AtlantOS, 39 pp., doi:10.3289/AtlantOS_D8.2
Dale, T., Cusack, C., Ruiz Villarreal, M., Leadbetter, A., Lyons, K., Burke, N., Smyth, D., Dabrowski, T., O'Rourke, E. and Gonzalez-Nuevo, G. (2018). Aquaculture operation Bulletin: Weather window nowcast/ forecast Bulletin tool for offshore aquaculture operators. AtlantOS Deliverable, D8.8, AtlantOS, 18 pp., doi:10.3289/AtlantOS_D8.8
Daniel, P. (1996). Operational forecasting of oil spill drift at Météo-France. Spill Science & Technology Bulletin, 3, 53-64, https://doi.org/10.1016/S1353-2561(96)00030-8
Daniel P. (2010). Drift forecasts for the Erika and Prestige oil spills. Practical Applications in Engineering, 27(4), https://doi.org/10.1002/9781118557792.ch27
Daniel, P., Drevillon, M., Levier, B., Gouriou, V. (2020). Relevant CMEMS products to predict oil slick drift in the Grande America accident. EGU General Assembly 2020, Online, 4-8 May 2020, EGU2020-13905.
Daniel, P., and Virasami, R. (2021). Oil spill management and salvage in the Indian Ocean. WMO Bulletin, 70(1), 109-110. More information available at: https://public.wmo.int/en/resources/bulletin/Products_and_services/Oil_spill_Indian_Ocean
Daniel P., Paradis, D., Gouriou, V., Le Roux, A., Garreau, P., Le Roux, J.-F., and Louazel, S. (2021). Forecast of oil slick drift from Ulysse/CSL Virginia and Grande America accidents. International Oil Spill Conference Proceedings 2021, 1, 1141410. Available at: https://archimer.ifremer.fr/doc/00742/85421/
De Carolis, G., Adamo, M., Pasquariello, G., De Padova, D., Mossa, M. (2013). Quantitative characterization of marine oil slick by satellite near-infrared imagery and oil drift modelling: the Fun Shai Hai case study. International Journal of Remote Sensing, 34, 1838-1854, https://doi.org/10.1080/01431161.2012.727494
De Dominicis, M., Pinardi, N., Zodiatis, G., Lardner, R. (2013). MEDSLIK-II, a Lagrangian marine surface oil spill model for short-term forecasting - Part 1: Theory. Geoscientific Model Development, 6, 1851-1869, https://doi.org/10.5194/gmd-6-1851-2013
Ingram, G.W. Jr. (2018). Annual Indices of Bluefin Tuna (Thunnus Thynnus) Spawning Biomass in the Gulf of Mexico (1977-2016). Collective Volumes of Scientific Papers ICCAT, 74(6), 2571-2771.
Ivanov, A.Y. (2010). The oil spill from a shipwreck in Kerch Strait: radar monitoring and numerical modelling. International Journal of Remote Sensing, 31, 4853-4868, https://doi.org/10.1080/01431161.2010.485215
Krata, P., and Szlapczynska, J. (2017). Ship weather routing optimization with dynamic constraints based on reliable synchronous roll prediction. Ocean Engineering, 150, 124-137, https://doi.org/10.1016/j.oceaneng.2017.12.049
Lee, S.-M., Roh, M.-I., Kim, K.-S., Jung, H., and Park, J.J. (2018). Method for a simultaneous determination of the path and the speed for ship route planning problems. Ocean Engineering, 157, 301-312, https://doi.org/10.1016/j.oceaneng.2018.03.068
Li, Z., Ryan, C., Huang, L., Ding, L., Ringsberg, J.W., and Giles, T. (2021). A comparison of two ship performance models against full-scale measurements on a cargo ship on the Northern Sea Route. Ships and Offshore Structures, 16, 237-244, https://doi.org/10.1080/17445302.2021.1926146
Liu, Y., MacFadyen, A., Zhen-Gang, J., Weisberg, R. H. (2013). Monitoring and Modeling the Deepwater Horizon Oil Spill: A Record Breaking Enterprise. American Geophysical Union, 271 pp., ISBN: 978-1-118-66675-3
Liubartseva, S., Smaoui, M., Coppini, G., Gonzalez, G., Lecci, R., Creti, S., Federico, I. (2020a). Model-based reconstruction of the Ulysse-Virginia oil spill October-November 2018. Marine Pollution Bulletin, 154, 111002, https://doi.org/10.1016/j.marpolbul.2020.111002
Liubartseva, S., Federico, I., Coppini, G., Lecci, R. (2020b). Oil spill modeling for the Port of Taranto (SE Italy). EGU General Assembly 2020, Online, 4-8 May 2020, EGU2020-2946.
Mannarini, G., Lecci, R., and Coppini, G. (2015). Introducing sailboats into ship routing system visir. In “2015 6th International Conference on Information, Intelligence, Systems and Applications (IISA)”, IEEE, 15723531, 1-6, https://doi.org/10.1109/IISA.2015.7387962
Mannarini, G., Pinardi, N., Coppini, G., Oddo, P., and Iafrati, A. (2016). VISIR-I: small vessels - least-time nautical routes using wave forecasts. Geoscientific Model Development, 9(4), 1597-1625, https://doi.org/10.5194/gmd-9-1597-2016
Mannarini, G., and Carelli, L. (2019). VISIR-1.b: ocean surface gravity waves and currents for energy-efficient navigation. Geoscientific Model Development, 12(8), 3449-3480, https://doi.org/10.5194/gmd-12-3449-2019
Mannarini, G., Subramani, D., Lermusiaux, P., and Pinardi, N. (2019). Graph-Search and Differential Equations for Time-Optimal Vessel Route Planning in Dynamic Ocean Waves. IEEE Transactions on Intelligent Transportation Systems, 21(8), 3581-3593, https://ieeexplore.ieee.org/document/8815853
Mannarini, G., Carelli, L., Orović, J., Martinkus, C.P., and Coppini, G. (2021). Towards Least-CO2 Ferry Routes in the Adriatic Sea. Journal of Marine Science and Engineering, 9(2), doi:10.1109/TITS.2019.2935614
Marcotte, G., Bourgouin, P., Mercier, G., Gauthier, J.-P., Pellerin, P., Smith, G., Onu, K., Brown, C.E. (2016). Canadian Oil Spill Modelling Suite: An overview. In “Proceedings of the 39th Arctic and Marine Oil Spill Program (AMOP) Technical Seminar”, Halifax, NS, Canada, 7-9 June 2016.
Micallef, L., Deidun, A., Cutajar, D., Gauci, A. (2014). The development of the MED-JELLY smartphone application in the Maltese islands. MED-JELLYRISK Conference and Training Seminar: Addressing Jellyfish Blooms to Safeguard Coastal Economic Activities Research, Innovation, Management and Education, St. Julian's. 29.
Morell Villalonga, M., Espino Infantes, M., Grifoll Colls, M., Mestres Ridge, M. (2020). Environmental management system for the analysis of oil spill risk using probabilistic simulations. Application at Tarragona Monobuoy. Journal of Marine Science and Engineering, 8(4), 277, https://doi.org/10.3390/jmse8040277
PIANC. (2012). PIANC-CODEPEC VIII. Proceedings of the Eighth International Conference on Coastal and Port Engineering in Developing Countries. IIT Madras, Chennai, India, 20-24 February 2012, https://www.pianc.org/uploads/publications/Proceedings-Congresses/proceedings-copedec/PIANC-COPEDEC-VIII-2012.pdf
Qiao, F., Wang, G., Yin, L., Zeng, K., Zhang, Y., Zhang, M., Xiao, B., Jiang, S., Chen, H., Chen, G. (2019). Modelling oil trajectories and potentially contaminated areas from the Sanchi oil spill. Science of The Total Environment, 685, 856-866, https://doi.org/10.1016/j.scitotenv.2019.06.255
Shchepetkin, A.F., and McWilliams, J.C. (2005). The regional oceanic modeling system (ROMS): a split-explicit, free-surface, topography-following-coordinate oceanic model. Ocean Modelling, 9(4), 347-404, https://doi.org/10.1016/j.ocemod.2004.08.002
Sorgente, R., La Guardia, D., Ribotti, A., Arrigo, M., Signa, A., Pessini, F., Oliva, G., Pes, A., Perilli, A., Di Maio, A. (2020). An operational supporting system for oil spill emergencies addressed to the Italian Coast Guard. Journal of Marine Science and Engineering, 8, 1035, https://doi.org/10.3390/jmse8121035
Spaulding, M.L., Howlett, E., Anderson, E., Jayko, K. (1992). OILMAP: A global approach to spill modeling (EC/EPS–93-01710), Canada.
Vettor, R., and Guedes Soares, C. (2016). Development of a ship weather routing system. Ocean Engineering, 123, 1-14, https://doi.org/10.1016/j.oceaneng.2016.06.035
Zelenke, B., O’Connor, C., Barker, C., Beegle-Krause, C.J., Eclipse, L. (2012). General NOAA Operational Modeling Environment (GNOME) Technical Documentation. U.S. Dept. of Commerce: Washington, DC, USA, NOAA Technical Memorandum OR&R; Emergency Response Division; NOAA: Seattle, WA, USA.
Zis, T.P., Psaraftis, H.N., and Ding, L. (2020). Ship weather routing: A taxonomy and survey. Ocean Engineering, 213, 107697, https://doi.org/10.1016/j.oceaneng.2020.107697
Chapter 11
To start contributing, sharing knowledge and editing the WIKI, please login !
Follow us