ForeSea - First results of SynObs Observing System Evaluation (OSE) experiments with Ocean Forecasting Systems.

Authors : Elisabeth Rémy (MOI, France), Yosuke Fujii (JMA/MRI, Japan)
Ocean real time monitoring systems are relying on the availability and accuracy of ocean observations to provide reliable analysis and forecasts. Among different usage of the observations in those systems, an essential one of them is to constrain the model analysis to stay close to the observations with data assimilation technics to ensure a realistic representation of the ocean state and reliable forecasts.
The SynObs project (https://oceanpredict.org/un-decade-of-ocean-science/synobs-2/), endorsed by the UN Decade programme ForeSea (https://oceanpredict.org/un-decade-of-ocean-science/foresea/), is focusing on estimating the role of different ocean observing networks, in situ and satellite, to constrain the ocean circulation in global and regional ocean analysis and forecasts as well as subseasonal to seasonal coupled ocean-atmosphere forecasts. The goal of SynObs project is to estimate the benefit of combining various observation platform measurements, typically satellite and in situ observation data, or combinations of coastal and open ocean platforms for ocean prediction. SynObs is driven by OceanPredict (https://oceanpredict.org/) Observing System Evaluation Task Team and ocean prediction centres worldwide and people managing ocean observing systems participate in SynObs activities.
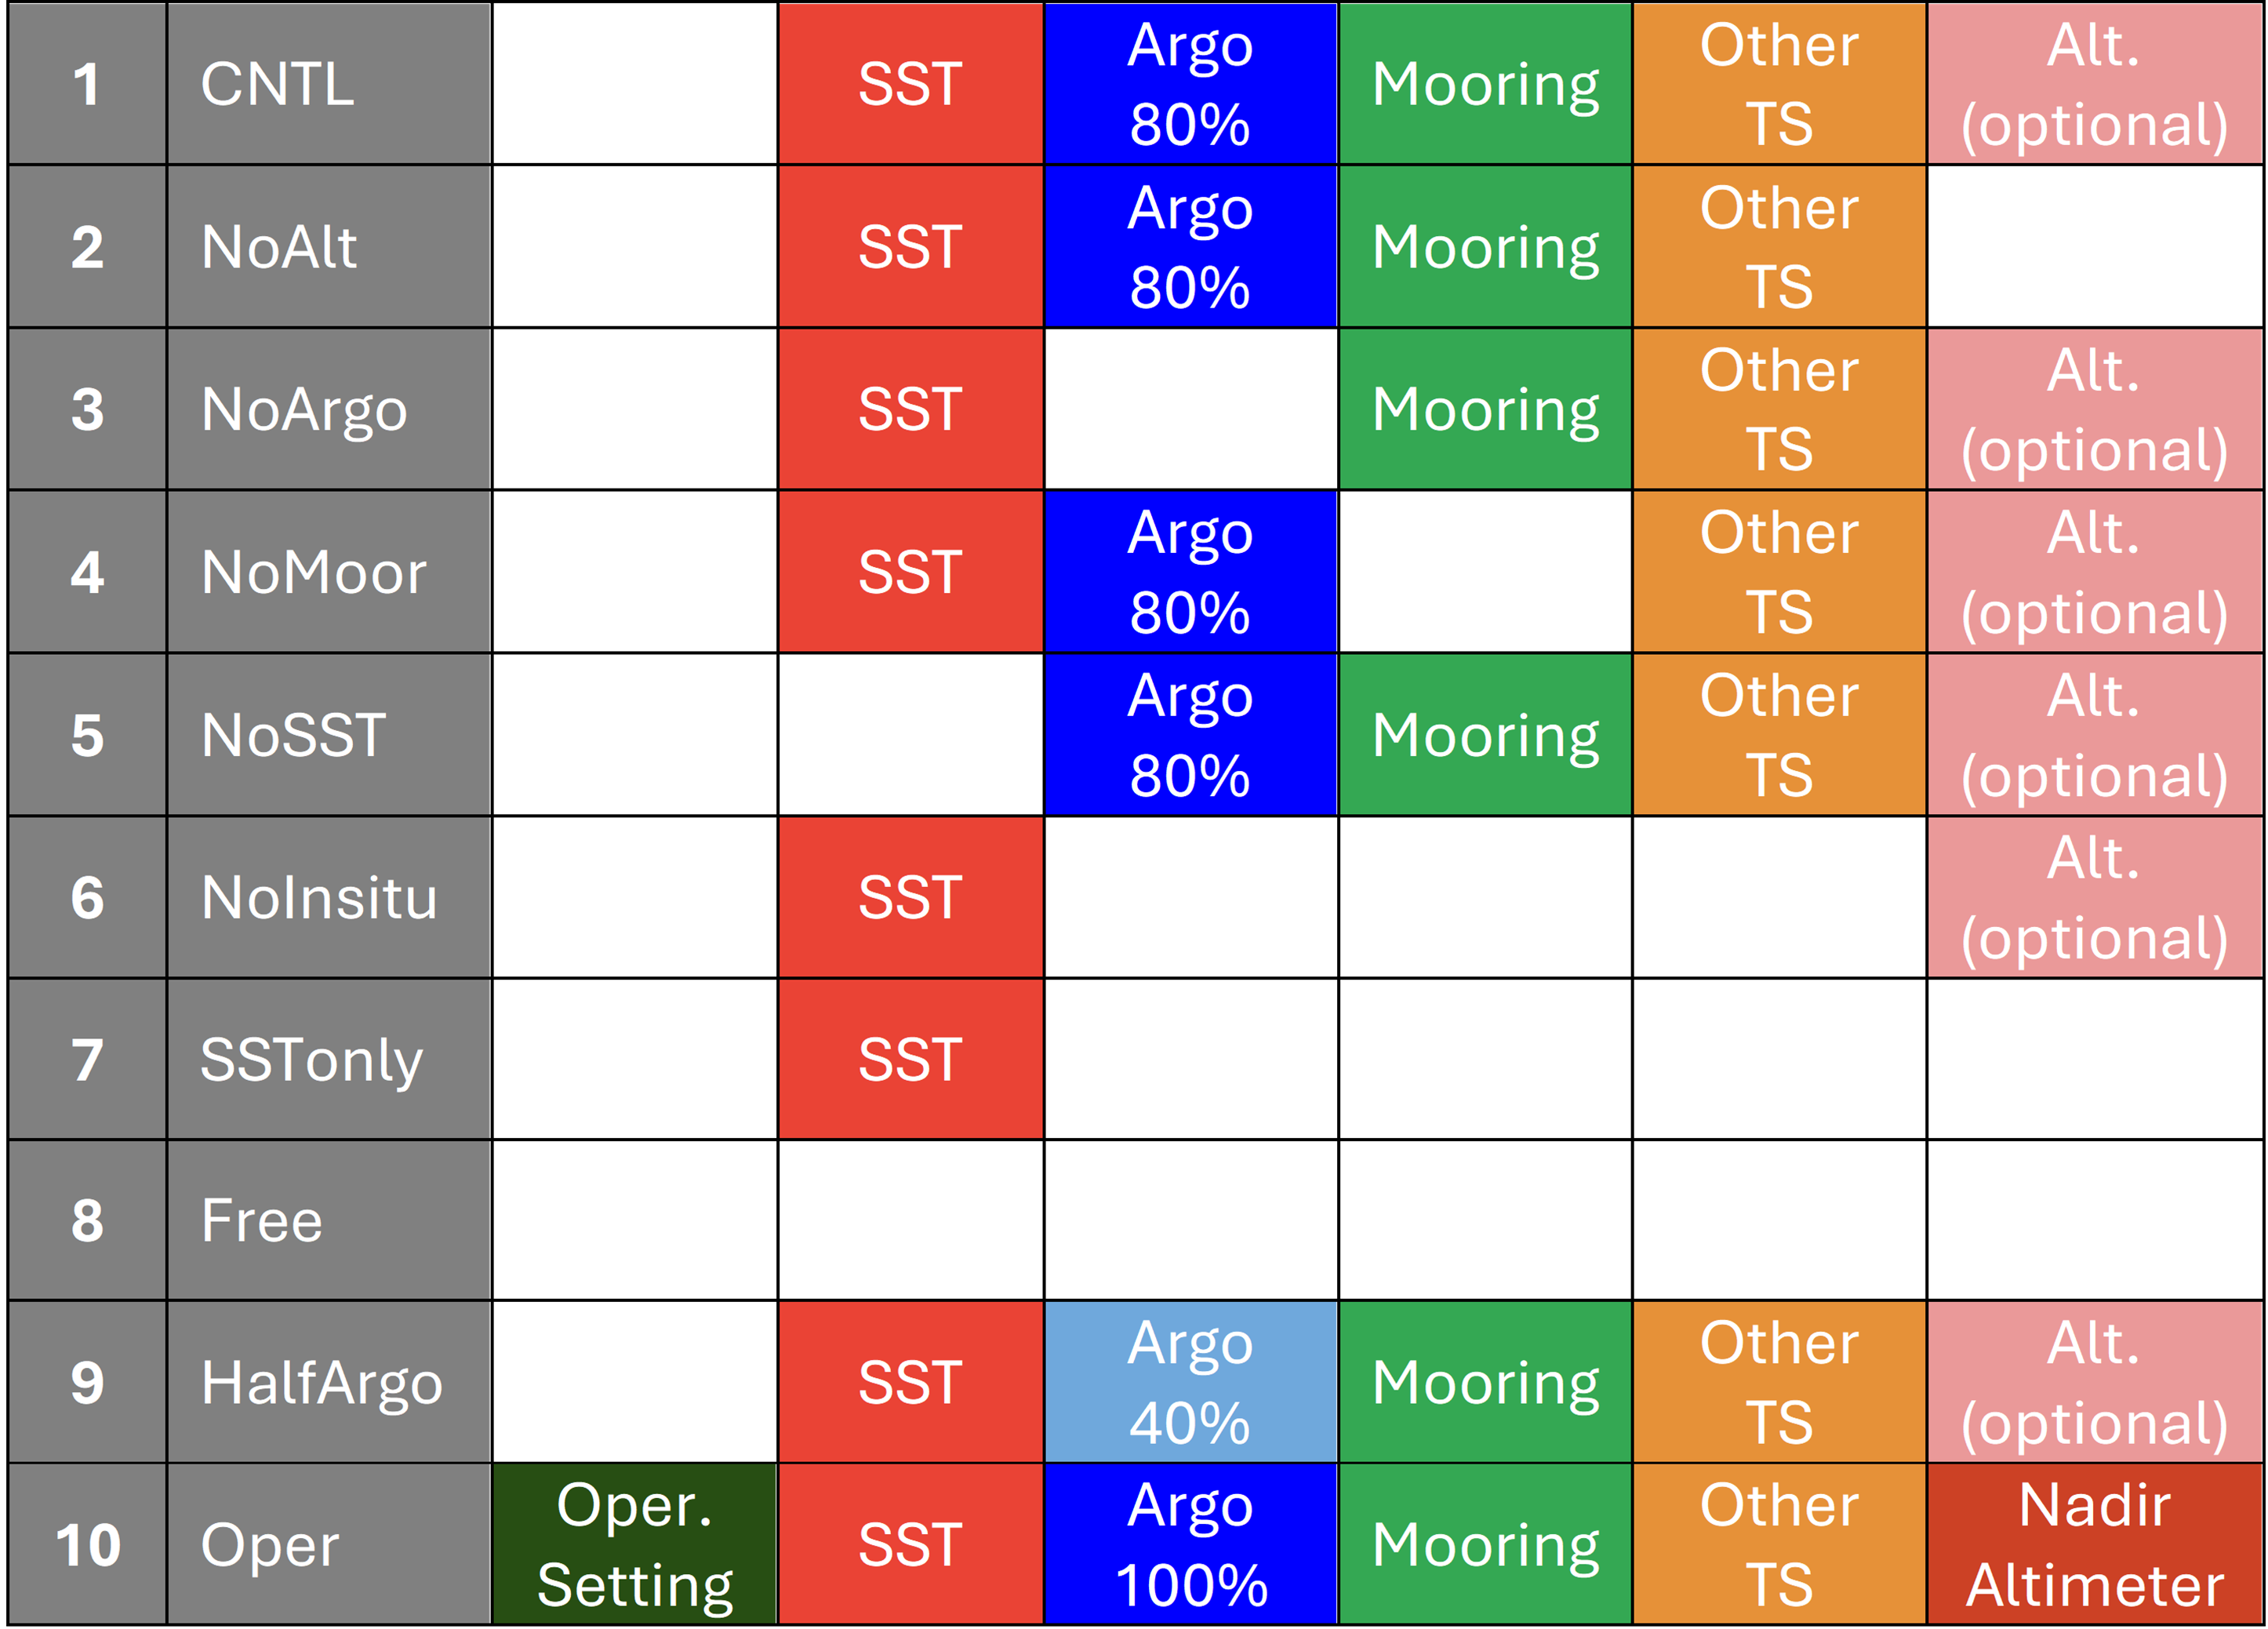
Common Observing System Experiments (the so-called OSEs) were defined (Tableau 1) and are currently performed by different ocean prediction centres. This multi-system approach will alleviate the results dependency to assimilation system configuration. Observing System Simulation Experiments (OSSEs) are also planned.
The Barcelona UN decade conference (https://oceandecade-conference.com/home.php) gave the project the opportunity to engage further with the exemplar projects under the UN Decade program “Ocean Observing Codesign” (Approach and first Exemplar Projects – Global Ocean Observing System (goosocean.org)) to help defining optimized observation network to efficiently monitor specific events or regions such as Marine Heatwave, Western Boundary Current and Tropical Cyclone.
We also had further exchange with the OneArgo project on enhancing the communication on the use, impact and expected evolution of the Argo networks to improve ocean analysis and forecasts (https://oceandecade.org/actions/oneargo-an-integrated-global-full-depth-and-multidisciplinary-ocean-observing-array-for-beyond-2020/).
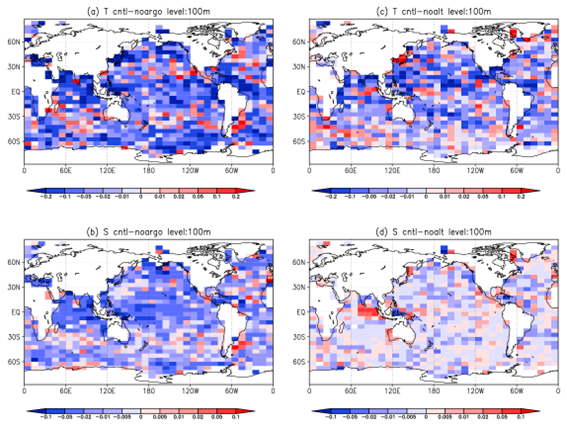
The first common OSE simulations have been now produced and more simulations are expected to be produced and made available by the end of the year on a common format and accessible to all to be analysed. This will allow anyone who do not have the capacity to produce such experiments to evaluate the impact of different observing networks on a large variety of ocean analysis and S2S forecasts on their own application/region. Figure 1 illustrates the degradation of temperature and salinity fields if Argo or satellite altimetry are removed from the JMA global ocean system.
To know more about this project and to participate to the common OSE experiments or their analysis, please email to the following address: synobs@mri-jma.go.jp.
Follow us